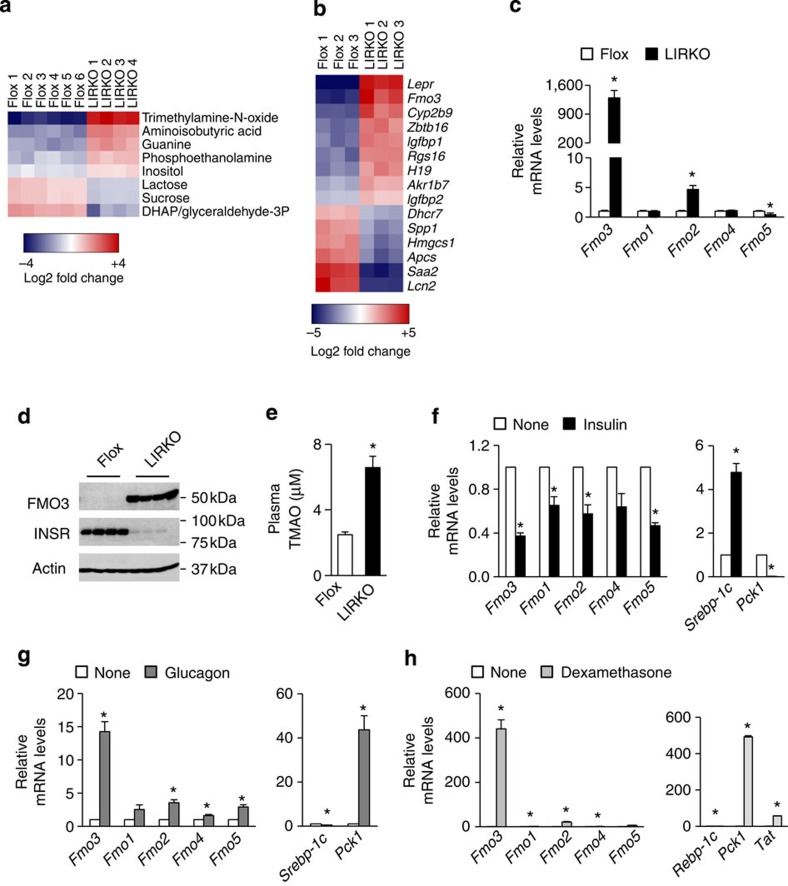
Figure 1. FMO3 is suppressed by insulin.
(a–e) The livers of 2-month-old non-fasted male Flox and LIRKO mice were subjected to metabolic profiling (a) and microarray analysis (b); all metabolites and genes with an adjusted P value <0.05 are shown. Alternatively, hepatic gene expression (c) was measured using real-time PCR and protein levels (d) were measured by western blotting whole-cell lysates. Plasma TMAO levels (e) were measured using LC/MS. Data represent the mean and s.e.m.; n=5–11; *P<0.05 (Student's t-test). (f–h) Gene expression was measured in primary hepatocytes from male rats (f,g) or mice (h) after 6 h of stimulation with insulin (f), glucagon (g) or dexamethasone (h). Average or representative results of two to four independent experiments are shown; *P<0.05 (Student's t-test); n=3 replicates per condition.

