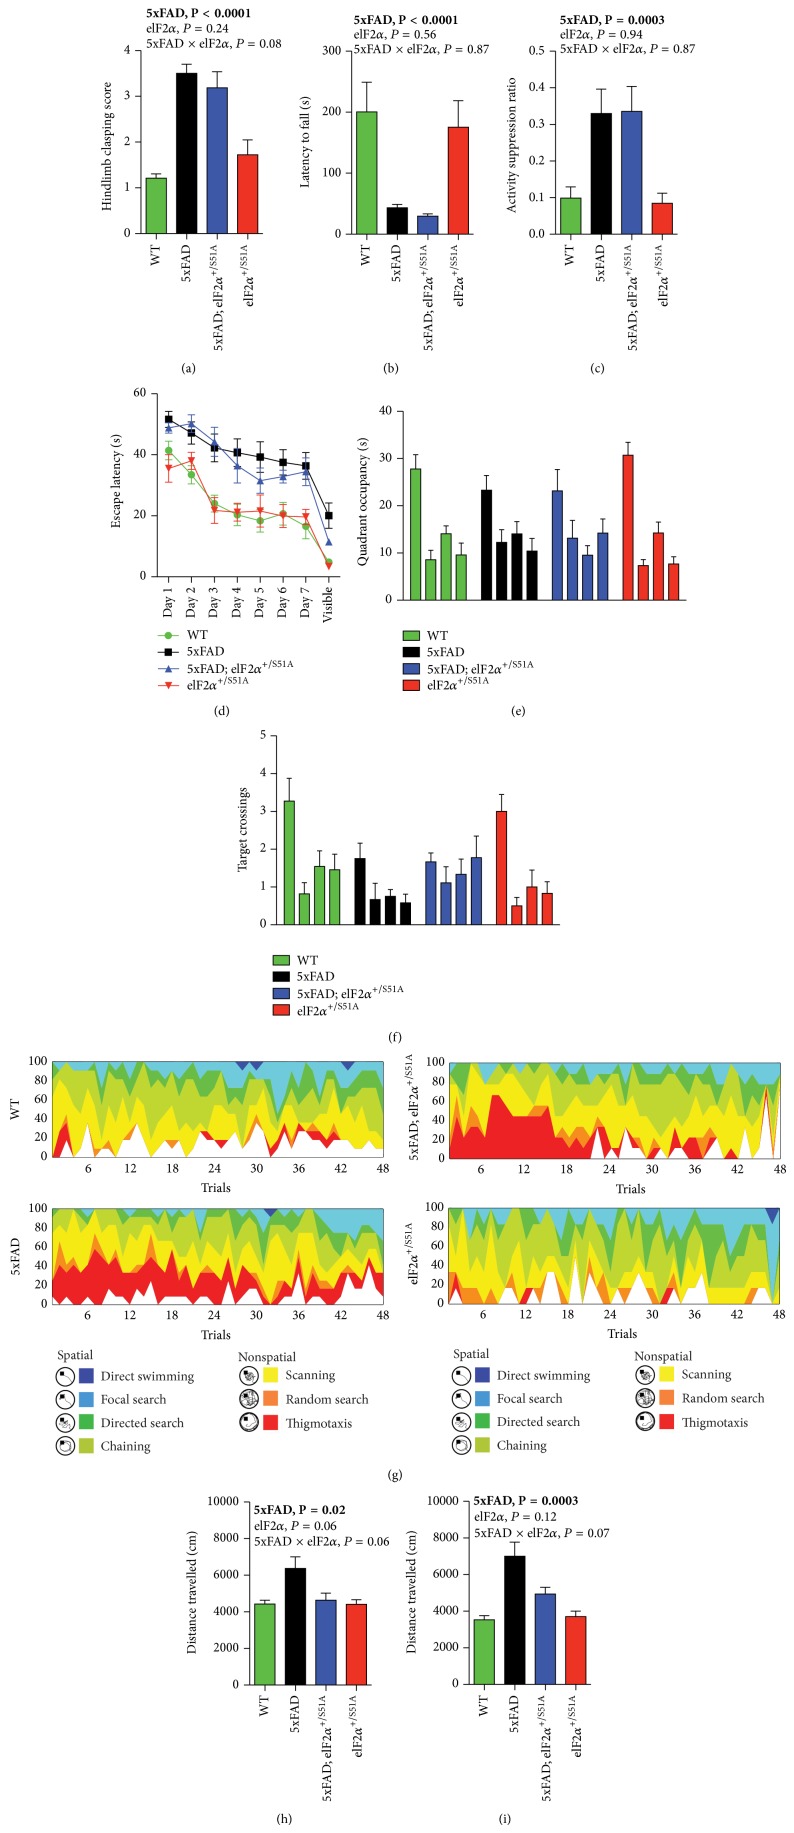
Figure 2.
The eIF2α S51A allele had limited effects on most neurological phenotypes but restored hyperactivity in 5xFAD mice. (a) Hindlimb clasping scores, as assessed in the tail suspension test (WT, n = 11 mice; 5xFAD, n = 12 mice; 5xFAD;eIF2α S51A, n = 9 mice; eIF2α S51A, n = 6 mice). (b) Latencies to fall in the context of a wire hang test (WT, n = 11 mice; 5xFAD, n = 13 mice; 5xFAD;eIF2α S51A, n = 11 mice; eIF2α S51A, n = 8 mice). (c) Activity suppression ratios in a context fear conditioning paradigm (WT, n = 11 mice; 5xFAD, n = 12 mice; 5xFAD;eIF2α S51A, n = 9 mice; eIF2α S51A, n = 6 mice). ((d)–(g)) Results of an assessment of spatial learning and memory in the Morris water maze (WT, n = 11 mice; 5xFAD, n = 12 mice; 5xFAD;eIF2α S51A, n = 9 mice; eIF2α S51A, n = 6 mice). (d) Escape latencies during training trials. (e) Quadrant occupancy and (f) target crossings measures obtained during a probe trial given after the completion of training day 7. For each genotype, bars represent (from left to right) target quadrant, opposite quadrant, adjacent right quadrant, and adjacent left quadrant. (g) Results of an extended swim path analysis: for each group, the proportion of animals in the respective search categories is plotted against training trial. ((h),(i)) Distance travelled in two open field experiments performed at either 8 months ((h); WT, n = 11 mice; 5xFAD, n = 13 mice; 5xFAD; eIF2α S51A, n = 11 mice; eIF2α S51A, n = 8 mice) or 11 months of age ((i); WT, n = 11 mice; 5xFAD, n = 13 mice; 5xFAD;eIF2α S51A, n = 11 mice; eIF2α S51A, n = 8 mice), respectively. Data were analyzed using two-way ANOVAs with the between-subjects factors 5xFAD genotype and eIF2α genotype ((a)–(c), (h), (i)) or using three-way ANOVAs with the between-subjects factors 5xFAD genotype and eIF2α genotype and the within-subjects factor trial (d) or quadrant ((e), (f)). Statistically significant differences (P < 0.05) are denoted by bold font. For additional information regarding the results of statistical analyses, see main text. Bar and line graphs show means ± SEM.

