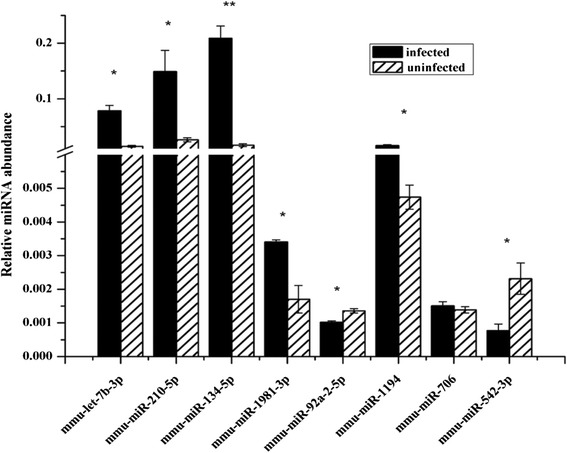
Figure 3.

Quantitative RT-PCR analyses of the levels of selected miRNAs in infected mice. Data illustrate representative experiments and show the mean and standard error derived from triplicate biological replicates. Pools of plasma from at least four S. japonicum infected mice and four uninfected controls were used in each biological experiment. *means P ≤ 0.05 and **means P ≤ 0.01 (student’s t test analysis).
