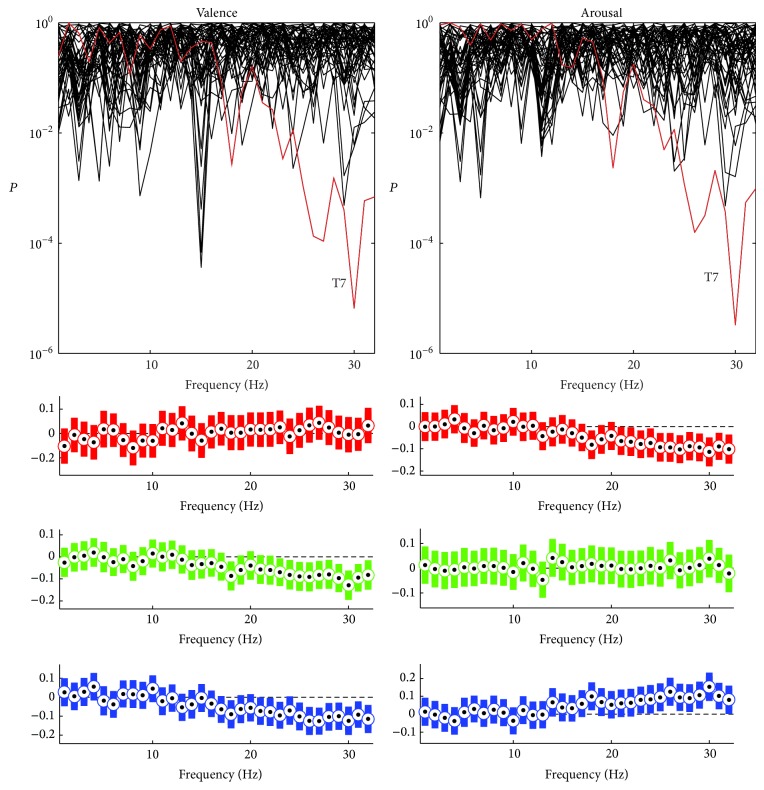
Figure 5.
The results of the statistical analysis for valence and arousal. In the upper row, the P values for the one-way ANOVA test are given separately for all of the features representing the activity in single frequencies between 1 and 32 Hz. Each trend corresponds to either a single channel or a channel pair. T7 is highlighted with red color. Below are the results of Tukey post hoc honestly significant difference test carried out separately for the features representing the activity in single frequencies of channel T7. Bars indicate the estimated difference in the class means and the 95% confidence intervals. For valence the comparison is made between the classes “unpleasant” and “neutral valence” (red), “unpleasant” and “pleasant” (green), and “neutral valence” and “pleasant” (blue). For arousal the comparison is made between “calm” and “medium arousal” (red), “calm” and “excited/activated” (green), and “medium arousal” and “excited/activate” (blue). If the bar does not contain value 0, the class means differ statistically significantly (P < 0.05).

