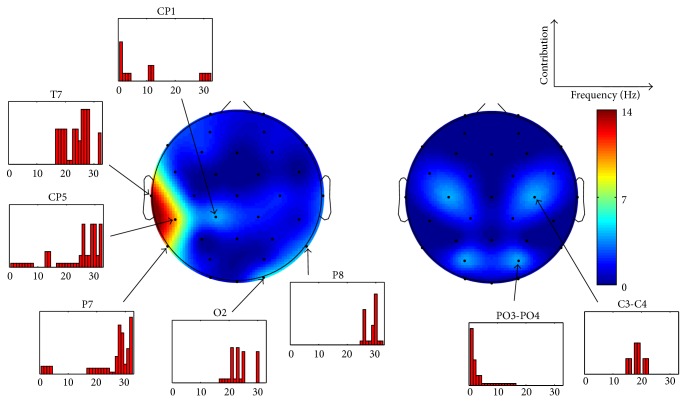
Figure 6.
The topographical distribution of features and the channel-wise contribution of different frequencies in the best performing feature set for arousal. The feature set contained 90 features. Spectral power (on the left) and spectral power difference (on the right) features are illustrated separately. The topographic plots are given in absolute scale representing the number of features.

