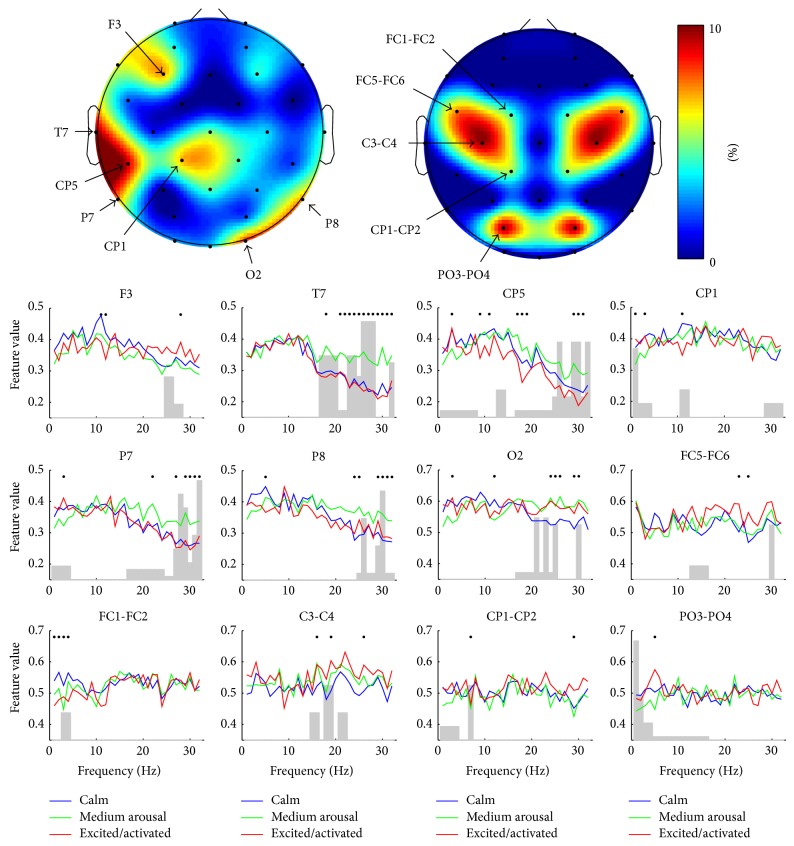
Figure 7.
The importance of different channels and frequencies in the classification of arousal. The topographic plots illustrate channel-wise how the classification performance is decreased if all the features in that specific channel are excluded from the best performing feature set. The plots have been made separately for the spectral power (on the left) and the spectral power difference (on the right) features. The channel-wise feature values for the three different classes of arousal are given below the topographic plots. The curves are the mean values of the features representing the single frequencies. The dots above the curves indicate that the values between the classes in that specific frequency differ statistically significantly (P < 0.05) according to one-way ANOVA test. The gray bars represent the contribution of different frequencies in that specific channel in the best performing feature set.

