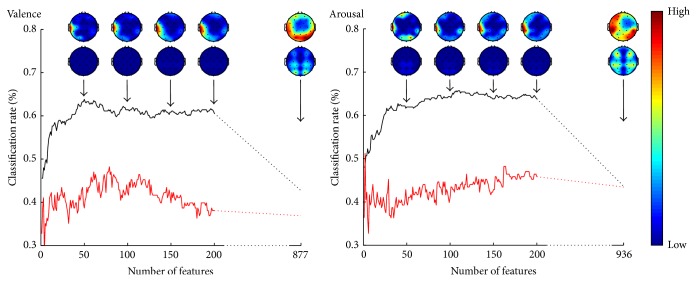
Figure 8.
The classification performance for training (black curve) and testing (red curve) sets and the topographical distribution of features as a function of number of features for valence and arousal. The topographic plots are given in relative scale red indicating high and blue low number of features. Spectral power (above) and spectral power difference (below) features are illustrated separately for 50, 100, 150, 200, and all preselected features.

