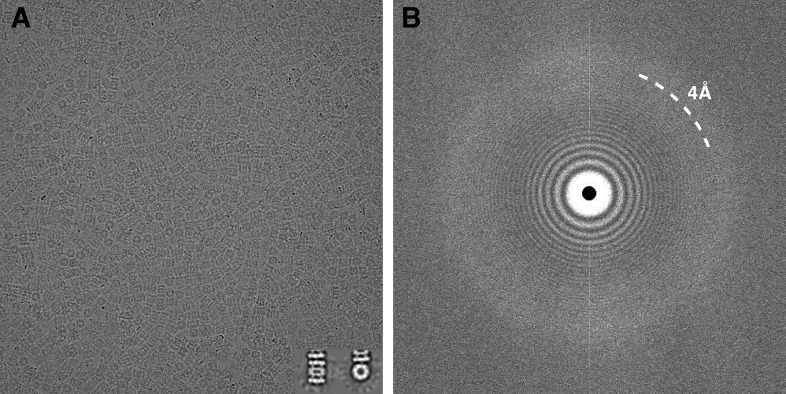
Figure 1. Typical micrograph of ice-embedded T20S proteasome and corresponding power spectrum.
(A) Micrograph of T20S after movie-frame alignment. Inset: Reference free 2D class averages showing a side view (left) and a top view (right). (B) Thon rings are visible well beyond 4 Å−1 resolution in the power spectrum of the micrograph shown in (A).

