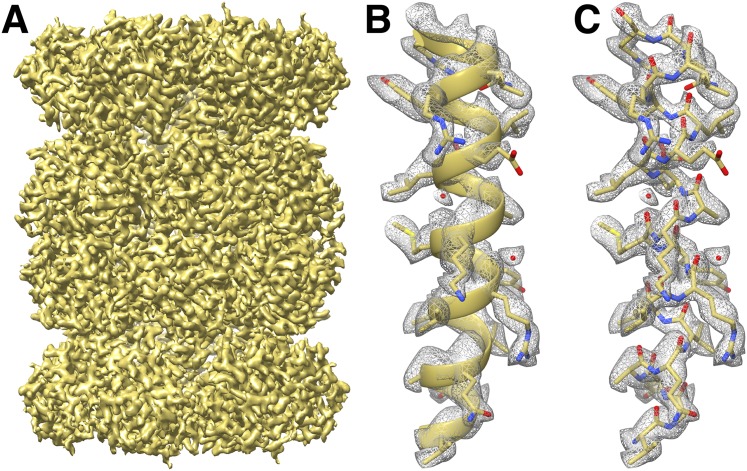
Figure 3. CryoEM reconstruction of the T20S at 2.8 Å resolution.
(A) Isosurface representation of the T20S map. (B) An α-helical segment from one β subunit is shown in ribbon representation docked into the corresponding region of the reconstruction. (C) Same α-helical segment as in (B) shown in atom representation docked into the corresponding region of the reconstruction. Several water molecules are visible.

