
Figure 1. n-3/6 LCPUFA composition of experimental diets and phospholipids from murine red blood cells and B cells.
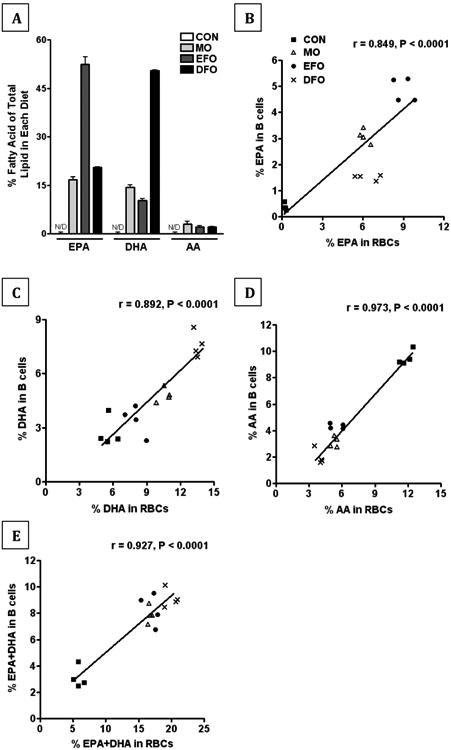
(A) The EPA, DHA, and AA content of the experimental diets (CON, MO, EFO, and DFO) were analyzed by gas chromatography. Triplicates were run on a single batch of each diet. Correlations of the (B) EPA, (C) DHA, (D) AA, and (E) EPA+DHA content between red blood cell phospholipids and B cell phospholipids from mice fed either CON, MO, EFO, or DFO diets was performed. A Pearson's r was used to assess the linear correlation between the two samples from each animal; n = 4 mice/group.