
Figure 2. Clustering of lipid microdomains on murine B cells.
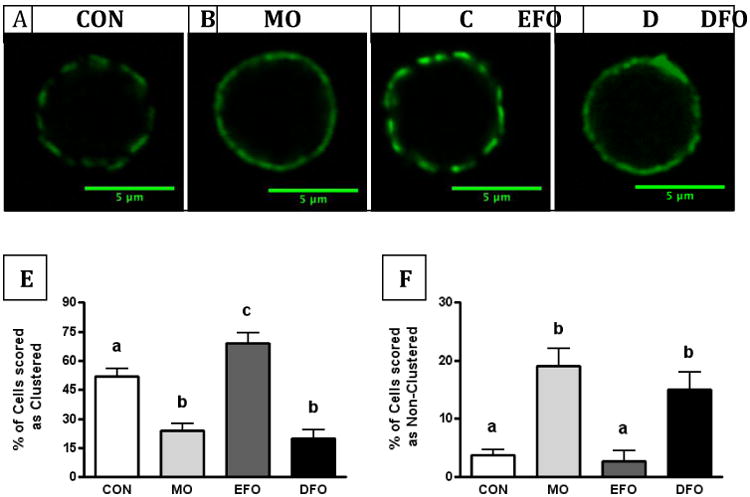
(A-D) Representative fluorescent images of lipid microdomains on purified, splenic B cells from SMAD3-/- mice fed CON, MO, EFO, or DFO diets. Cholera toxin subunit B conjugated to FITC was used to visualize GM1, an extensively used reporter of lipid rafts. Blinded scoring analysis of fluorescent lipid microdomains on cells as (E) clustered or (F) non-clustered. Data are represented as mean ± SEM, whereby 10 cells were scored per animal and n = 10-15 mice/group. Different letters denote statistically significant differences at the P < 0.05 level.