
Figure 4. Antigen uptake in murine B cells.
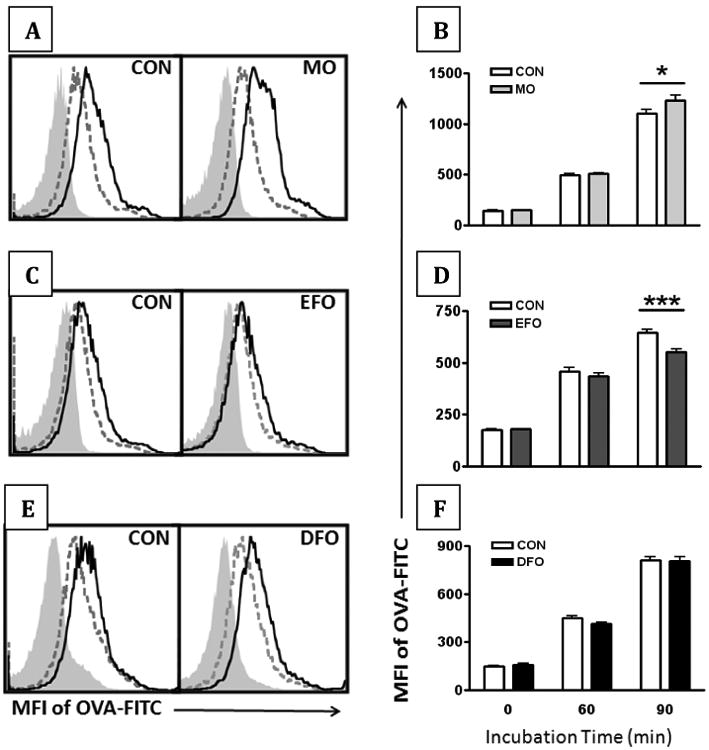
Uptake of ovalbumin conjugated to FITC (OVA-FITC) was used as a model antigen to assess B cell antigen uptake. Purified, splenic B cells from SMAD3-/- mice fed CON, MO, EFO, and DFO diets were incubated at 37°C for 0, 60, and 90 min. (A+C+E) Representative histograms demonstrate an increase in the MFI of OVA-FITC from 0 min (filled, light grey) to 60 min (dashed, dark grey) to 90 min (solid black). (B+D+F) Change over time of OVA-FITC MFI on purified B cells. Data are represented as mean ± SEM; n = 10-15 mice/group. Each of the fish oil treatments were performed separately and therefore have their own controls. Asterisks indicate significant differences compared to the CON diet: * P < 0.05 *** P < 0.001