
Figure 5. in vivo B cell subset phenotyping of spleen and bone marrow.
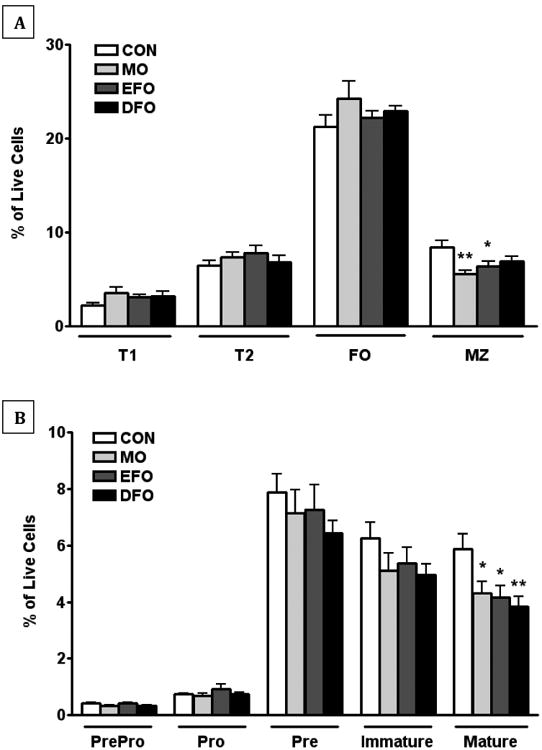
Flow cytometric phenotyping of B cell subsets was performed on spleen and bone marrow tissues in SMAD3-/- mice fed CON, MO, EFO, or DFO diets. (A) Splenic B cells (B220+) subsets were phenotyped as T1 B cells (CD23-CD24Bright CD21-), T2 B cells (CD23- CD24Bright CD21Bright/Dim and CD23+ CD24Bright/Dim CD21Bright), follicular B cells (CD23+/- CD24Dim CD21Dim), and marginal zone B cells (CD23- CD24Bright/Dim CD21Bright). (B) Bone marrow precursor and developmental B cells (B220+) subsets were phenotyped as pre-pro-B cells (IgD- IgM- CD24+ CD43-), pro-B cells (IgD- IgM- CD24+ CD43+), pre-B cells (IgD-IgM- CD24- CD43), immature B cells (IgM+ IgD-), and mature B cells (IgM+ IgD+). Data are represented as mean ± SEM; n = 10 mice/group. Asterisks indicate significant differences compared to the CON diet: * P < 0.05 ** P < 0.01