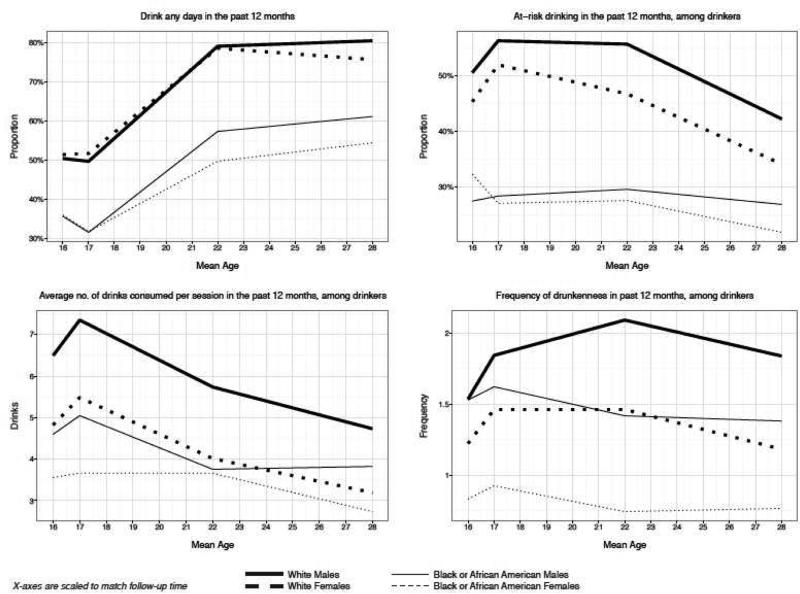
Figure 1.
Descriptive proportions and means for alcohol use outcomes by race and gender in the National Longitudinal Study of Adolescent Health
*Mean ages based on four waves of data collection. Wave 1 (mean age: 16.03); Wave 2 (mean age: 15.99); Wave 3 (mean age: 21.85); Wave 4 (mean age: 29.00). Wave 1 and Wave 2 were separated by one year, however the mean age of the Wave 2 sample is slightly lower than the mean age of the Wave 1 sample (Wave 1: 16.03; Wave 2: 15.99). Respondents that were no longer in high school at the Wave 2 interview, however, remained eligible for the Wave 3 and 4 interviews and were re-contacted. We display them on the graph as one year apart given the time difference in data collection.

