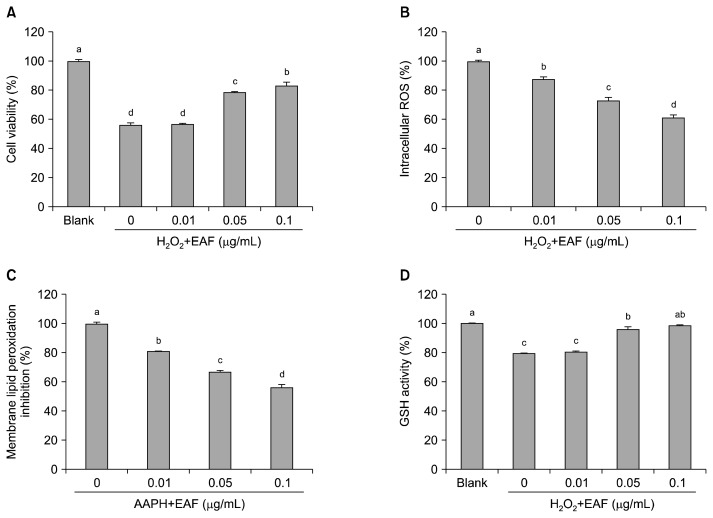
Fig. 3.
Effects of EAF on cytoprotection (A), intracellular ROS formation (B), membrane lipid peroxidation (C), and GSH level (D) in the cultured human hepatocytes under oxidative stress. The bars with different (a–d) letters represent significant differences (P<0.05). Values are expressed as means±SD (n=3).

