Figure 5.
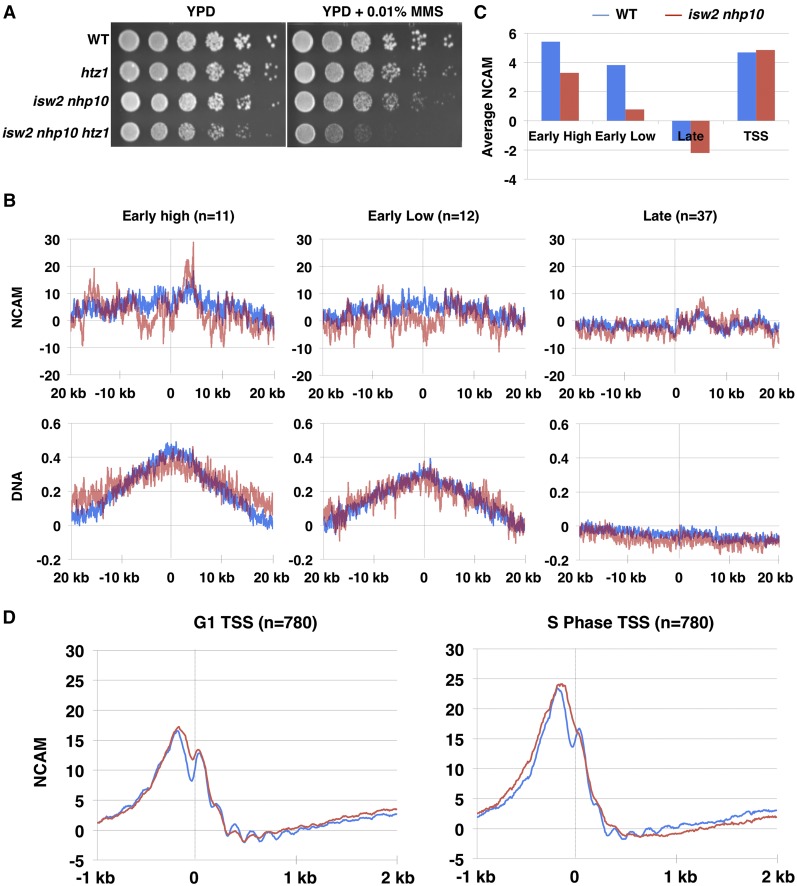
Isw2 and Ino80 increase chromatin accessibility at replicating regions. (A) Spot assay of htz1 and htz1 isw2 nhp10 cells grown at 30°, as described previously (Au et al. 2011), on YPD and YPD with 0.01% MMS. (B) Graphs represent NCAM and DNA profiles over a 40-kb window from three classes of origin on chromosomes III, VI, and XII: early high (n = 11), early low (n = 12), and late (n = 37). The dashed line indicates the origin midpoint. (C) Measurement of NCAM around replication origins in WT and isw2 nhp10 cells. WT cells are depicted in blue, while isw2 nhp10 cells are in red. NCAM has been Z-score normalized by the +2 to +6 ORF nucleosomes. To visualize S-phase-specific changes, S-phase NCAM was subtracted from G1 NCAM. The bar graph quantitates the average S-phase-specific differences in NCAM from 40 kb around origins in C and 3 kb around TSSs in D. (D) NCAM signal from all TSSs (n = 780) at G1 and S phase in MMS in a 3-kb window. The dashed line indicates the TSS midpoint.

