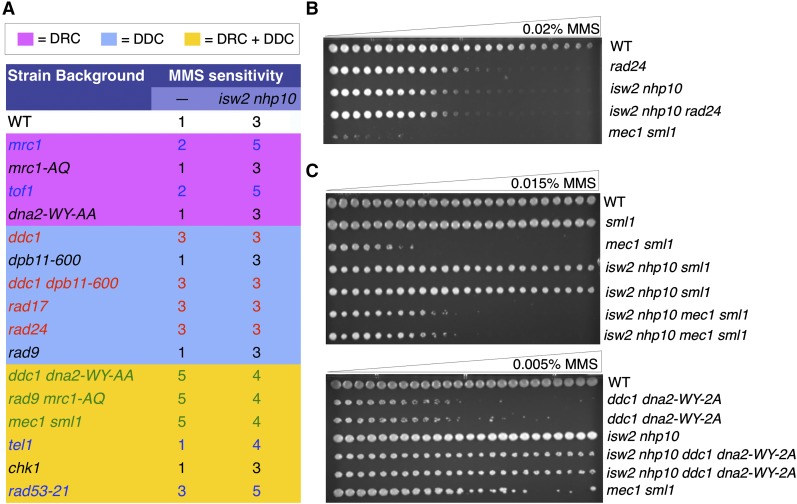
Figure 6.
Isw2 and Nhp10 antagonize checkpoint activators. (A) A summary of the spot-test results with checkpoint proteins. MMS sensitivity is ranked on a scale of 1–6, with 1 being the least sensitive (WT level) and 6 being the most sensitive. Mutated genes are grouped into colored boxes, with pink representing the DRC genes, blue representing the DDC genes, and yellow presenting components of both DRC and DDC genes. Results are color-coded, with blue indicating additive sensitivity, red indicating similar sensitivity, and green indicating a partial rescue in sensitivity with the deletion of ISW2 and NHP10. The mutations in black did not show detectable MMS sensitivity as single mutants and exhibited no genetic interactions with isw2 nhp10. (B) The gradient plate shows the lack of genetic interactions between ISW2, NHP10, and RAD24. (C) Both gradient plates show a partial rescue of varying degrees to MMS sensitivity of either the mec1 sml1 mutant (top panel) or the ddc1 dna2-WY-2A mutant (bottom panel) by isw2 nhp10 mutation.

