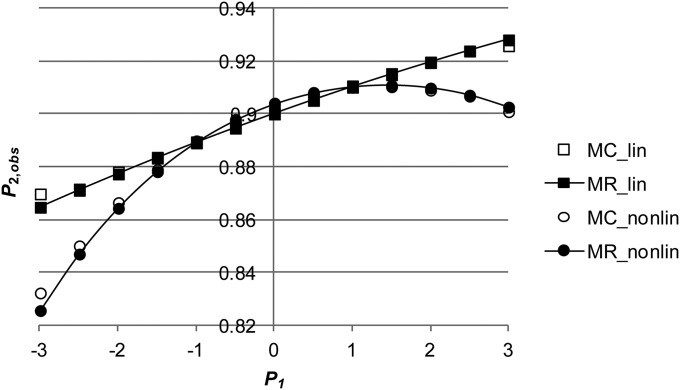
Figure 6.
The relationship between the proportion of surviving animals and using Monte Carlo simulation (MC_lin) and multiple regression (MR_lin) either with no genetic correlation () or with a negative genetic correlation () (MC_nonlin, MR_nonlin) between environmental variance in and the mean of on the underlying scale ( average proportion for = 0.9).

