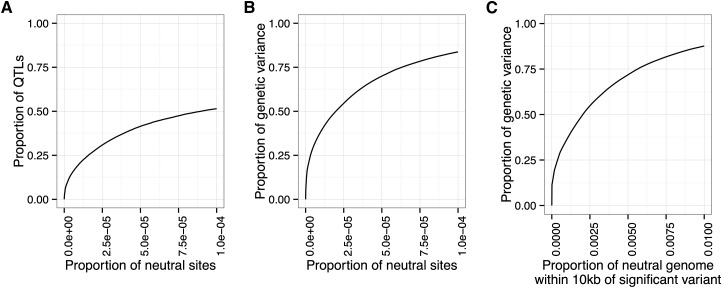
Figure 3.
Comparison of three methods for calculating and interpreting power and false-positive rate. (A) Power is measured by the proportion of QTL detected, and false-positive rate is measured by the proportion of neutral variant sites detected. (B) Power is measured by the proportion of genetic variance in the founder population explained by the detected QTL, and false-positive rate is measured as in A. (C) Power is measured as in B, and false-positive rate is measured by the proportion of the neutral genome covered by the detection region. In this case, the ROC curve shows that >75% of the genetic variance is explained by QTL in a detection region that covers 1% of the neutral genome.

