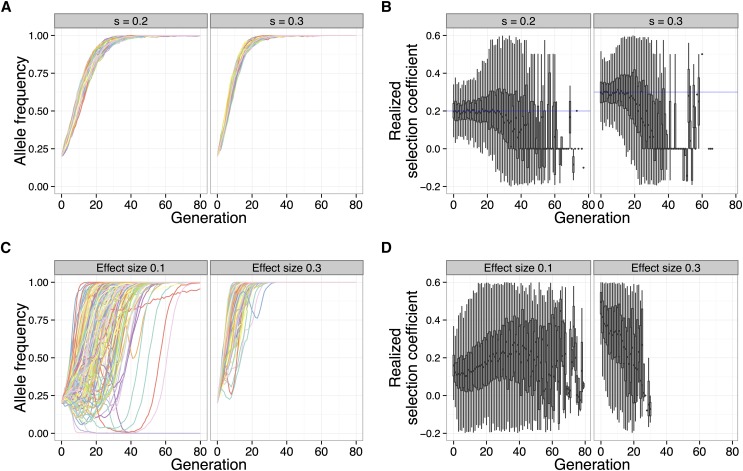
Figure 4.
Qualitative differences between fixed selection coefficient and truncation selection on a quantitative trait. A focal QTL exhibits fundamentally different behavior under a constant selection coefficient, compared to truncation selection on a quantitative trait. Shown are allele frequency trajectories (A) and realized selection coefficient distributions (B) of a locus under two different selection coefficients (0.2, 0.3) (N = 1000, 80 generations). C and D show the same for a focal QTL (effect sizes 0.1, 0.3) under truncation selection on the trait (N = 5000, selected, 80 generations, 100 QTL, , ).

