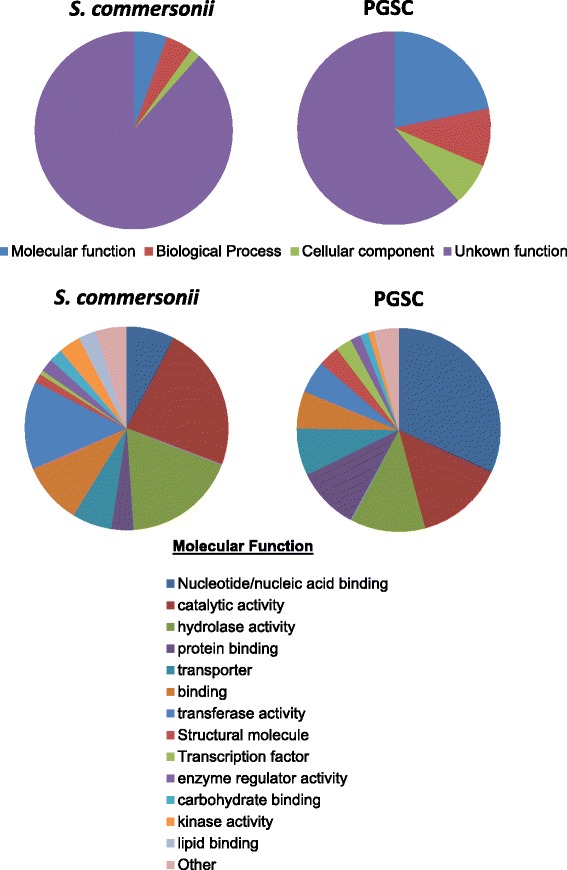
Figure 2.

Gene Ontology category distribution of novel S. commersonii transcripts and predicted genes in the reference S. tuberosum DM genome. Pie charts on the top show gene distribution according to major Gene Ontology Categories. The bottom charts detail sub-categories of molecular function. Nucleotide/nucleic acid binding includes the categories: Nucleotide binding, DNA binding, Nucleic acid binding and RNA binding. All categories below 2% of representation in both gene sets (signal transducer activity, molecular function, receptor activity, translation factor activity, nuclease activity, chromatin binding, motor activity, receptor binding) were grouped in “Other”. PSGC: Potato Genome Sequence Consortium.
