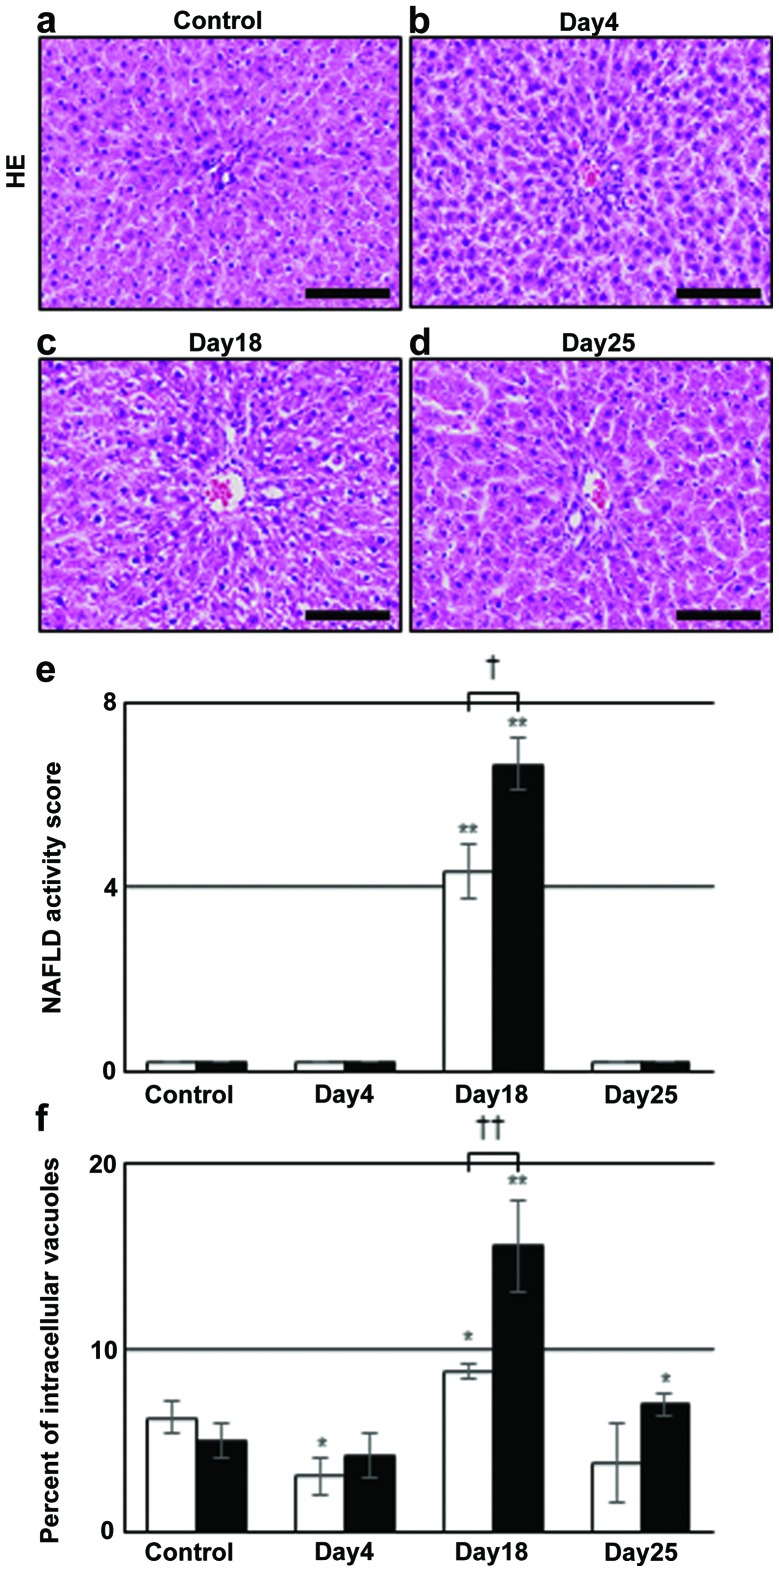
Figure 1.
H&E staining of liver sections and the quantitative evaluation of intracellular vacuoles. (a–d) H&E staining in (a) control and irinotecan group on days (b) 4, (c) 18 and (d) 25. The data shown are from a representative preparation set and are similar to results obtained in two other sets. Intracellular vacuoles are markedly increased at day 18. Scale bars represent 100 μm. (e) Nonalcoholic fatty liver disease (NAFLD) activity score on H&E-stained liver sections, depending on steatosis grade (0–3), location (0–3) and microvesicular steatosis (0–1). Open bars indicate scores around CV and closed bars those around BD. Data are the mean ± SD from 3 rats. (f) Percentage of intracellular vacuoles/unit area (0.036 mm2), calculated by subtracting sinusoid areas from the unstained areas of H&E-stained sections. Data are the mean ± SD from 3 rats. *p<0.05 vs. control; **p<0.01 vs. control (two-tailed Student’s t-test). †p<0.05 and ††p<0.01 between values around CV and those around BD (two-tailed Student’s t-test). H&E, hematoxylin and eosin; CV, central vein; BD, bile ducts.

