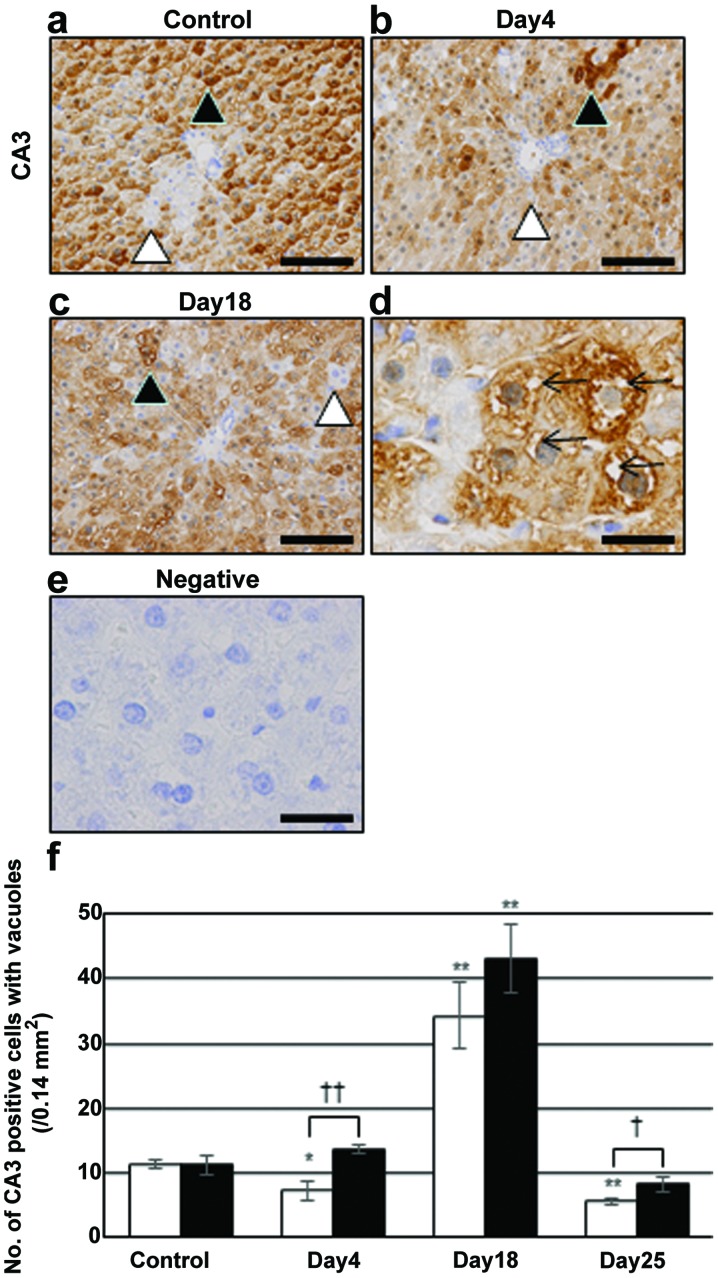
Figure 2.
Immunostaining for CA3 in (a) control and irinotecan group on days (b) 4 and (c and d) 18. Liver sections of control group were stained with non-immune (e) γ-globulin. (d) The panel is at a higher magnification in the (c) panel. Closed and open arrowheads indicate positive and negative hepatocytes, respectively. (d) Arrows in the panel show intracellular vacuoles. The data shown are from a representative preparation set and are similar to results obtained in two other sets. (a–c) Scale bars 100 μm and (d and e) 25 μm. (f) Number of CA3-positive hepatocytes accompanying intracellular vacuoles. Open bars indicate the number around the CV and closed bars around the BD. Data are the mean ± SD from 3 rats. *p<0.05 vs. control; **p<0.01 vs. control (two-tailed Student’s t-test). †p<0.05 and ††p<0.01 between the values for CV and for the BD (two-tailed Student’s t-test). CA3, carbonic anhydrase 3; CV, central vein; BD, bile ducts.

