Figure 4.
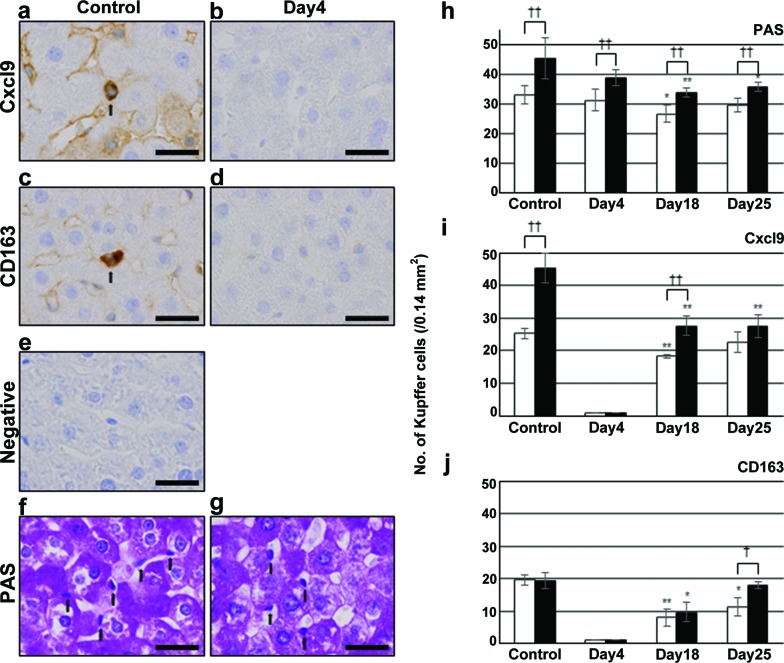
Immunostaining for (a and b) Cxcl9, (c and d) CD163 and (f and g) PAS staining in (a, c, e and f) control and irinotecan group on (b, d and g) day 4. Liver sections of control group were also stained with (e) non-immune γ-globulin. (a, c, f and g) Arrows indicate positive-Kupffer cells. The data shown are from a representative preparation set and are similar to results obtained in two other sets. Scale bars represent 25 μm. The number of Kupffer cells counted with (h) PAS staining and immunostaining for (i) Cxcl9 and (j) CD163 in control and irinotecan group on days 4, 18 and 25. Open bars indicate values around the CV and closed bars around the BD. Data are the mean ± SD from 3 rats. These cells in liver sections were from five microscope fields (0.14 mm2/field) for each rat. *p<0.05 vs. control; **p<0.01 vs. control (two-tailed Student’s t-test). †p<0.05 between values around the CV and those around the BD; ††p<0.01 between values for the CV and for the BD (two-tailed Student’s t-test). Cxcl9, chemokine (C-X-C motif) ligand 9; PAS, periodic acid-Schiff; CV, central vein; BD, bile ducts.

