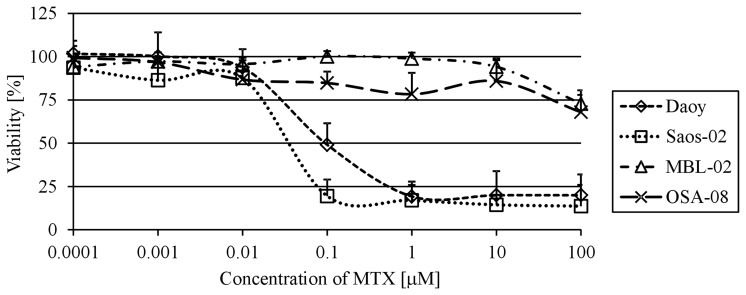
Figure 1.
Dose-response curves and IC50 values of MTX. Cells were incubated with different doses of MTX for 6 days. Cell viability was analyzed using the MTT assay. Data are presented as the means + standard deviations. x-axis, doses of MTX in μM. y-axis, percentage of viability relative to the untreated cells. MTX, methotrexate.

