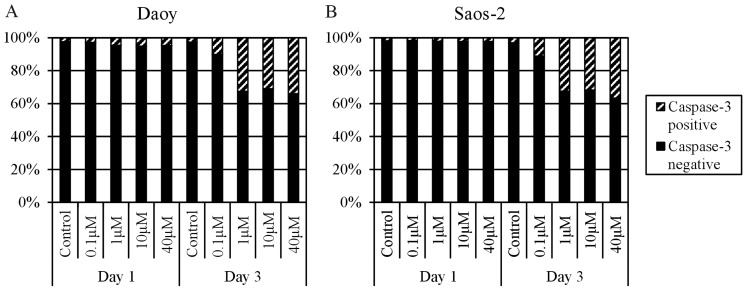
Figure 5.
Flow cytometric analysis of caspase-3 positivity in (A) Daoy and (B) Saos-2 cells following MTX treatment. Cells were analyzed at day 1 and 3 of incubation. x-axis, doses of MTX and days of treatment. y-axis, percentage of caspase-3-positive/negative cells in the cell populations. MTX, methotrexate.

