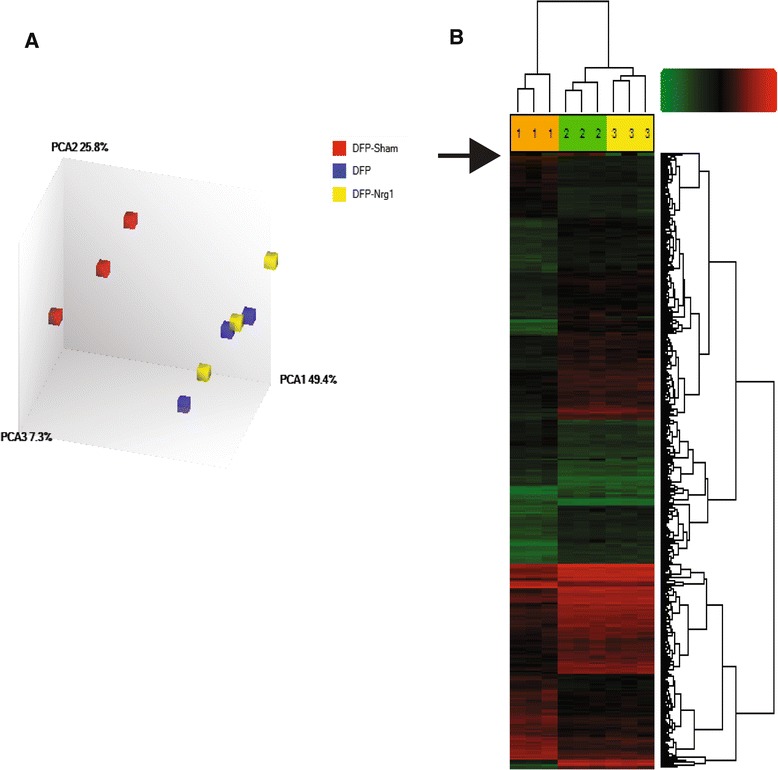
Figure 5.

NRG-1 prevents DFP-induced hippocampal gene expression. Gene expression profiles in the hippocampus of three treatment groups (control, DFP, and DFP + NRG-1) were determined by mRNA microarray using the rat genome U230 2.0 GeneChip that contains approximately 30,000 probe sets (transcripts). (A) To assess inter-experiment differences in the intensity of gene expression, replicate experiments were compared for each experimental group and the resulting datasets analyzed by principle component analysis (PCA). The control samples clustered together and were distinct from and not overlapping with the DFP and DFP + NRG-1 groups, which were similar to each other. (B) Hierarchical cluster analysis graphically illustrates that approximately 1,300 genes were induced following DFP administration and that the induction of a small subset of these (indicated by the arrow) were attenuated by NRG-1 pretreatment. Green indicates genes with low level or no expression and red indicates genes with increased expression levels. Three animals were compared from each treatment group: (1) control; (2) DFP; and (3) DFP + NRG-1. DFP, diisopropylflurophosphate; NRG-1, neuregulin-1.
