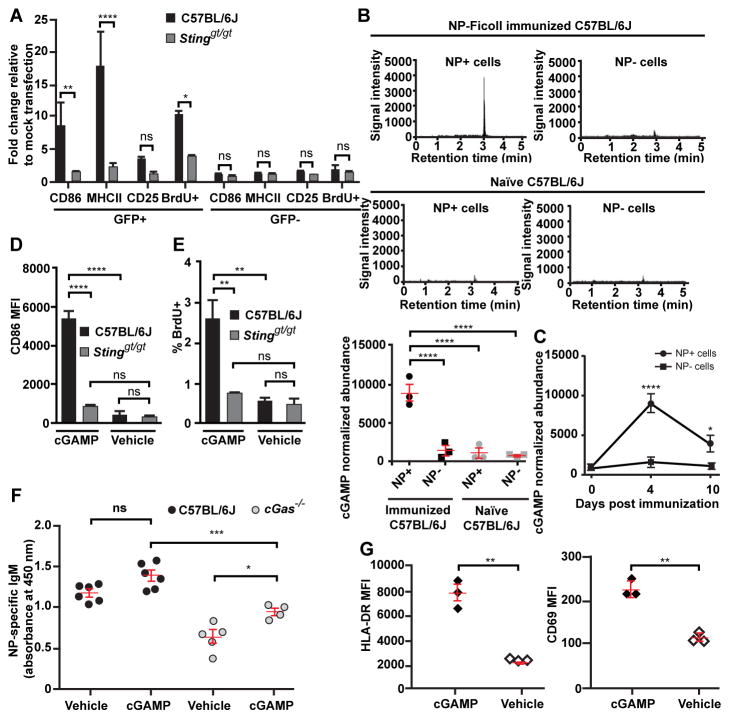
Figure 2. cGAMP is elevated within antigen-specific B cells following TI-2 immunization and is sufficient to drive B cell activation in vitro and in vivo.
(A) CD86, MHC class II, and CD25 expression, and BrdU incorporation by GFP+ or GFP− splenic CD19+ B cells 36 hours after transfection with a GFP expression plasmid. N = 3 C57BL/6J mice, 3 Stinggt/gt mice. (B) cGAMP level measured by liquid chromatogryph-tandem mass spectrometry (LC-MS/MS) in 2×10⁵ NP-specific or non-NP-specific splenic CD19+ B cells from C57BL/6J mice on day 4.5 post-immunization with NP-Ficoll (N = 3) or in naïve mice (N = 3). Upper panels, chromatograms of cGAMP. Lower panel, cGAMP abundance normalized to cell number for each sample. (C) Time course of cGAMP levels in NP-specific or non-NP-specific B cells from C57BL/6J mice (N = 3) immunized with NP-Ficoll. (D and E) CD86 expression (D) or the percentage of BrdU+ splenic B cells (E) after treatment with cGAMP or vehicle for 2 days in vitro. N = 3 C57BL/6J mice, 3 Stinggt/gt mice. (F) Serum NP-specific IgM on day 5 post-immunization with NP-Ficoll plus cGAMP or NP-Ficoll plus vehicle. (G) HLA-DR or CD69 expression by human B cells isolated from healthy donor peripheral blood after treatment with cGAMP or vehicle for 2 days in vitro. MFI, mean fluorescence intensity. Data points represent individual mice or humans (B, F, G). P values were determined by one-way (A–B, D–F) or two-way ANOVA and post hoc Tukey test (C) or Student’s t test (G). Results are representative of 2–3 independent experiments.

