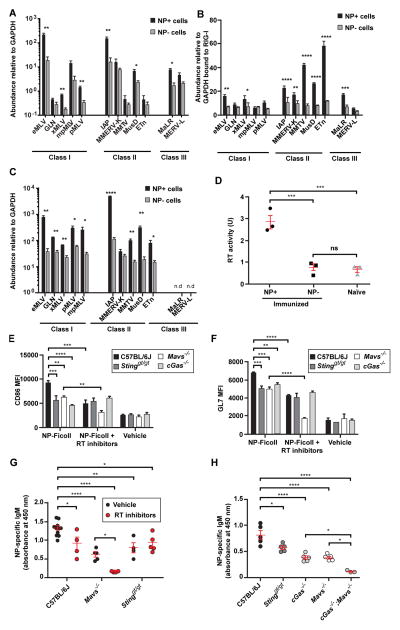
Figure 3. TI-2 antigen immunization induces expression of ERV mRNA and cDNA that are detected by cytosolic sensors in antigen-specific B cells.
Splenic NP-specific or non-NP-specific CD19+ B cells were collected from C57BL/6J mice (A, C and D) or IghB1-8+ transgenic mice (B) 4.5 days post-immunization with NP-Ficoll (N = 3 per experiment). (A) Transcript levels of the indicated ERVs measured by RT-qPCR of mRNA isolated from NP-specific or non-NP-specific B cells. Data were normalized to GAPDH mRNA levels in the same cells. Due to copy number differences the magnitude of upregulation of different ERVs cannot be directly compared in this experiment. (B) IghB1-8+ transgenic mice express a recombined variable region derived from an NP-binding antibody in place of the endogenous 3′ Igh-D element (DQ52) and the Igh-J elements. RT-qPCR of the indicated ERV mRNAs immunoprecipitated with RIG-I from NP-specific or non-NP-specific B cells. Data were normalized to the level of GAPDH mRNA bound to RIG-I in the same samples, which represents a non-specific interaction equivalent in NP-specific and non-NP-specific cells as shown in fig. S7E. (C) qPCR of ERV DNA in the cytoplasmic fraction of NP-specific or non-NP-specific B cells. Data were normalized to GAPDH intronic DNA levels in the same cells. Note that endogenous eMLV and MMTV were amplified with primers targeting spliced cDNAs; these species likely represent a minority of the cytoplasmic eMLV and MMTV cDNAs and thus may not precisely reflect total eMLV and MMTV cDNA levels. (D) RT activity in the indicated B cells from C57BL/6J mice. (E and F) Splenic CD19+ B cells from mice of the indicated genotypes were treated with NP-Ficoll plus RT inhibitors (AZT, NVP, ddI) or NP-Ficoll plus vehicle for 2 days, and CD86 (E) or GL7 expression (F) was measured in NP-specific B cells. N = 3 mice for each genotype. MFI, mean fluorescence intensity. (G) Serum NP-specific IgM on day 4.5 post-NP-Ficoll immunization of mice pretreated for 3 days with RT inhibitors (AZT, NVP) or vehicle. RT inhibitor treatment continued after immunization until measurement of serum IgM. (H) Serum NP-specific IgM on day 4.5 post-immunization with NP-Ficoll. Data points represent individual mice (D, G, H). P values were determined by Student’s t test (A–C) or one-way ANOVA and post hoc Tukey test (D–H). n.d., not detected. Results are representative of 2–3 independent experiments.

