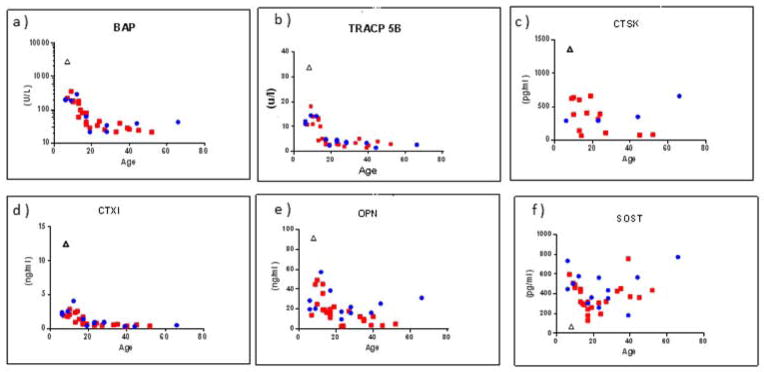
Figure 5. Serum Multiplex Biomarker Profiling.

Select profiles (Supplementary Appendix) represent elevation of all BTMs, especially those of apposition, including BAP (a), TRACP-5b (b), CTX1 (c), CTSK (d), and OPN (e), whereas SOST is distinctly low (f).
