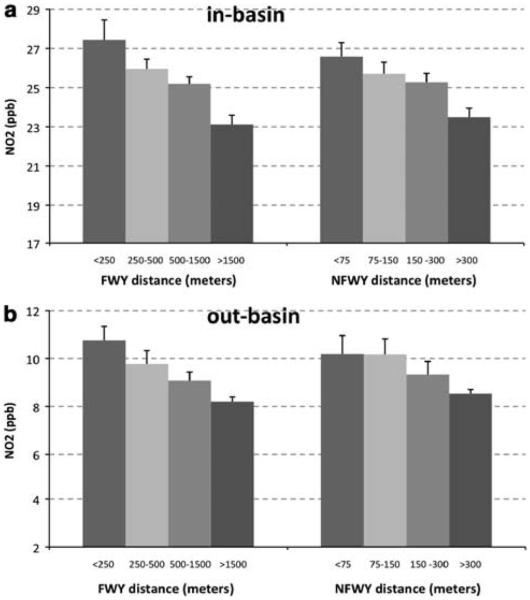
Figure 4.
Predicted concentrations of NO2 based on proximity to a freeway (FWY) or non-freeway (NFWY) major road. Vertical bars indicate the upper bound of the 95% confidence limit for each prediction. Results are shown for two types of communities: (a) within the LA basin with overall mean NO2 level 25.3 p.p.b. and (b) outside the LA basin with overall mean 9.5 p.p.b.

