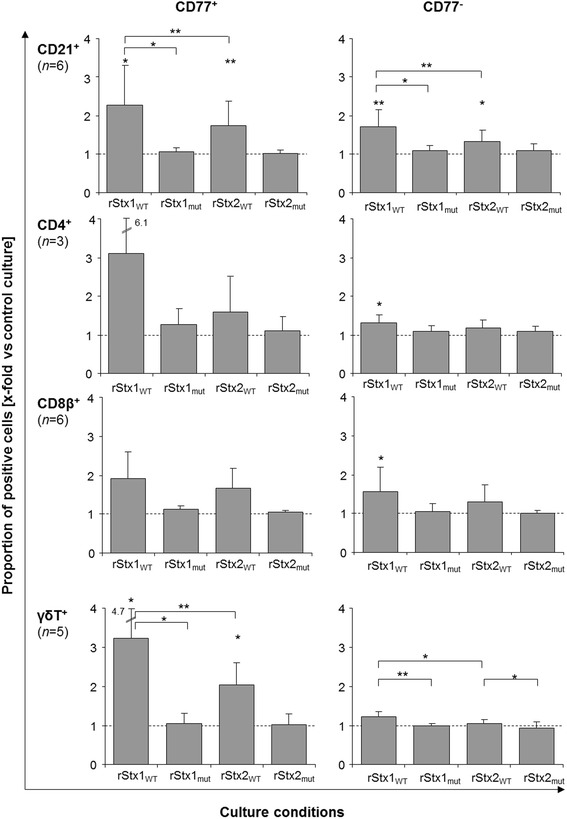
Figure 5.

Late-apoptotic/necrotic cells within PBMC subsets after in vitro challenge with recombinant Shiga toxins and toxoids. Proportions of 7AAD positive cells expressing (left row) or not expressing CD77 (right row) within PBMC subsets in PHA-P stimulated cultures are shown relative to data obtained from PHA-P stimulated cultures incubated in the presence of the vector control (control cultures; defined as 1.0, indicated by the dashed line). Data is depicted as means ± standard deviations of 3 to 6 repetitive experiments as indicated. Statistical analysis was performed as described in legend to Figure 2. Significance levels were defined as p ≤ 0.001 [***], p ≤ 0.01 [**], and p ≤ 0.05 [*].
