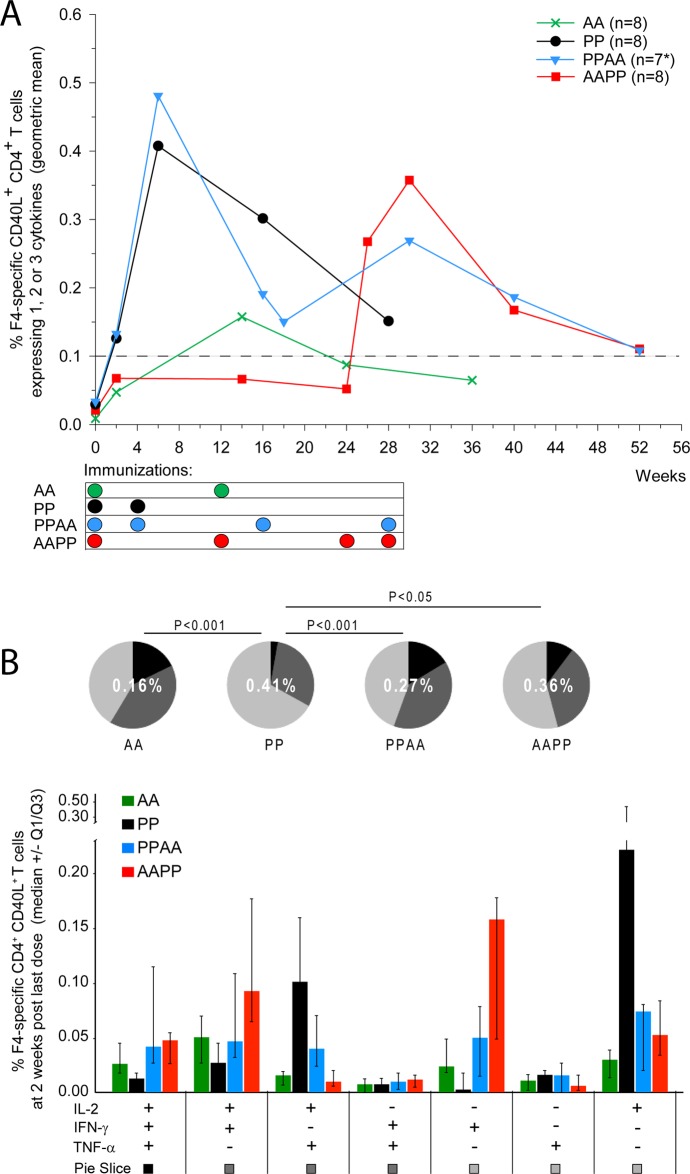
Fig 1. HIV-1-specific CD4+ T-cell responses in NHP.
Rhesus macaques were immunized intramuscularly with F4/AS01 (‘P’) and/or AdC7-GRN (‘A’), according to the following regimens: weeks 0 and 4 (PP group), weeks 0 and 12 (AA group), weeks 0, 4, 16 and 28 (PPAA group) and weeks 0, 12, 24 and 28 (AAPP group). A. PBMCs were stimulated in vitro overnight with a pool of peptides covering the F4 antigen sequence, and production of IL-2, IFN- and TNF- was measured by ICS. Frequency of F4-specific CD4+ T cells was expressed as the percentage of CD40L+ CD3+ CD4+ T cells expressing IFN-γ and/or TNF-α and/or IL2 of all CD3+ CD4+ T cells. Data are represented as group geometric mean frequencies. *: PPAA group: N = 8 at Weeks 0, 2 and 6, and N = 7 at all time-points thereafter. The dashed line indicates the assay cut-off value for CD40L+ CD4+ T cells (i.e., 0.1%). B. The cytokine co-expression profile of F4-specific CD4+ T cells at 2 weeks post last immunization is presented for each prime-boost regimen. Data are reported as median frequencies of responding CD40L+ CD4+ T cells expressing any combination of IL-2, IFN- and TNF-, with first and third quartiles measured. Pie charts represent the group mean proportions of responding CD40L+ CD4+ T cells expressing (after in vitro stimulation) one, two or three cytokines (represented in light grey, dark grey and black, respectively) among IL-2, IFN- and TNF-. These group mean proportions were compared using Fisher’s exact test and a significance level of p<0.05. The number in the center of each pie represents the geometric mean of the total percentage of cytokine-expressing CD40L+ CD4+ T cells at 2 weeks post last immunization.

