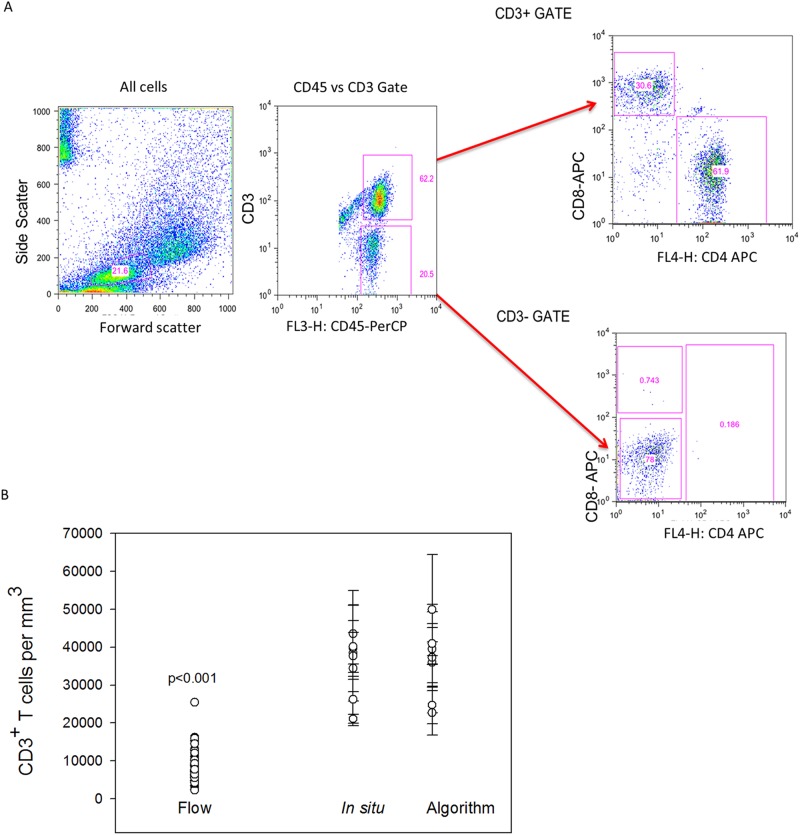
Fig 4. Comparison of automated counts of in situ sigmoid colonic and rectal mucosal T lymphocytes versus isolation and flow cytometric counting.
Mucosal CD3+ T lymphocytes were isolated by mechanical tissue disruption and collagenase digestion. (A) Gating strategy for flow cytometric analysis of isolated lymphocytes. (B) Comparison of the mean numbers of sigmoid colonic mucosal CD3+ lymphocytes isolated from 30 sigmoid biopsies from similar persons versus automated (n = 48) and manual counting of 5 sigmoid biopsies and 5 rectal biopsies from 5 subjects. Dots represent the means of 3–5 regions analyzed with bars representing standard error of the means. (Mann-Whitney Rank Sum test p<0.001).

