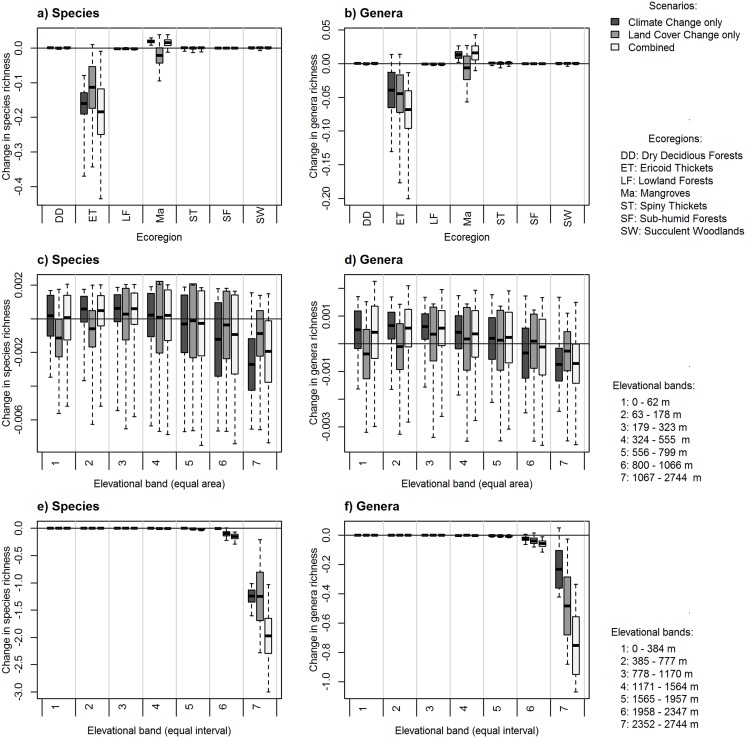
Fig 4. Loss and gain in plant species and genera richness (measured on a pixel-by-pixel basis and normalized by area, km2) across different zonal systems for (a, b) ecoregions found in Madagascar, (c, d) equal area elevation bands (each with an area of approximately 105 000 km2), and (e, f) equal interval elevation bands (at intervals of 390 m).
Changes under each scenario are shown as: climate only scenario (dark grey), land cover only scenario (mid-grey) and the combined scenario (light grey). The mean is indicated with a solid horizontal line, the shaded areas represent ±1 standard deviation, whilst dashed lines extend to the minimum and maximum values.

