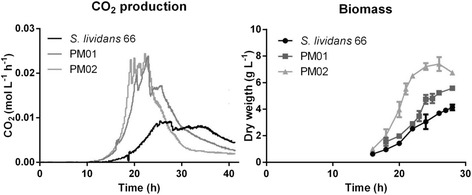
Figure 2.

Growth of S. lividans 66 and its derivatives PM01 and PM02 in a bioreactor. 1.3 liter reactors were inoculated with 106 spores/mL in TSBS medium. CO2 levels were measured by an off-gas analyser and biomass accumulation was measured as dry weight from 10 mL freeze-dried broth that was collected and washed on a glass fibre filter. The data shown are the average of three separate fermentations. Error bars in the biomass graphs represent the standard error of the mean; the CO2 data had a deviation of less than 5%.
