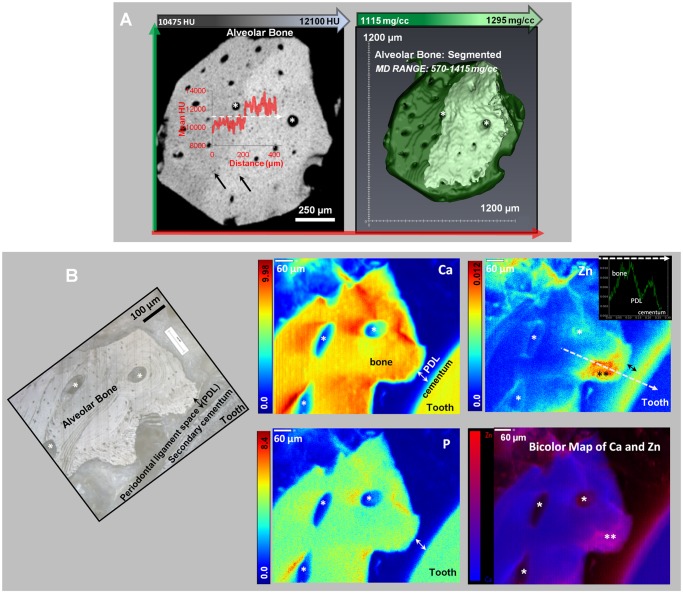
Fig 3. Segmented regions of different mineral densities in alveolar bone.
TOP PANEL: A) Left image shows X-ray virtual slice of alveolar bone with higher and lower attenuating regions. Inset illustrates a gradient (red curve) in X-ray attenuation along a line profile (white dotted line). Black arrows represent osteocyte-lacunae spaces, white asterisks are blood vessels or endosteal spaces. Right panel shows 3D segmentation of alveolar bone (MD Range: 1115–1295 mg/cc) with two regions of different mineral densities that complement regions in x-ray attenuation map in bottom panel; BOTTOM PANEL: B) Left image shows a light microscope micrograph at 10X of an ultrasectioned alveolar bone block specimen. White asterisks likely indicate endosteal spaces. Right panels are XRF area maps with concentration gradients in Ca, Zn, and P in mmol/cm3. Note that the white asterisks in XRF micrographs indicate the same anatomical locations as in the light microscope image. A representative line profile in the Zn image map (white dotted line, in mmol/cm3) vs. distance (mm) from bone to cementum is shown. The black double-asterisk on Zn XRF map indicates a bony protrusion in the PDL-space. The bicolor map of Ca and Zn in the bottom right panel is an overlay of Ca and Zn XRF signals. Within this map, regions dominated by Ca are blue, and regions dominated by Zn are red. An overlap of the two elements is indicated by shades of pink to purple.

