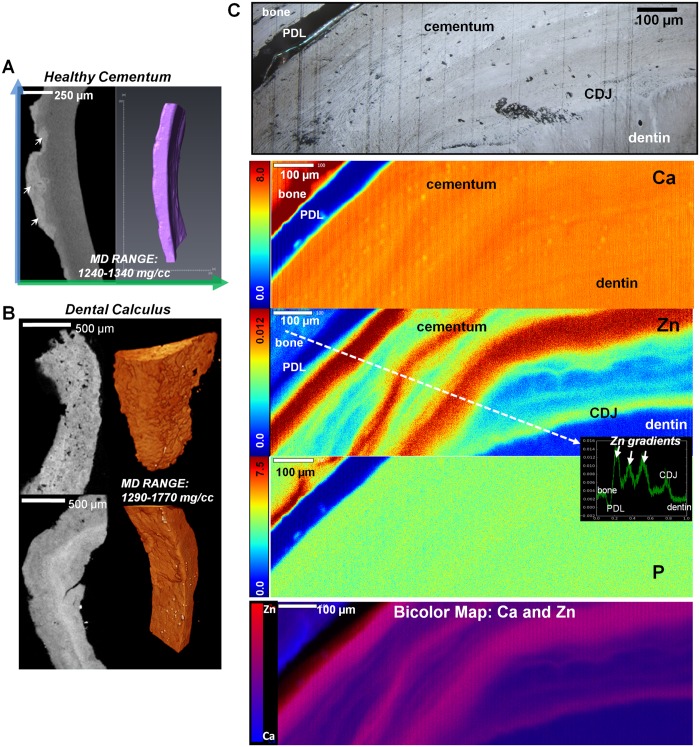
Fig 4. Segmented regions of different mineral densities in cementum.
A) X-ray virtual sections of cementum from a periodontically infected tooth illustrates affected cementum with dental calculus (white arrows). Following segmentation (right panel), a narrow mineral density range was identified; B) Mineral gradients in dental calculus with micro-CT 2D virtual sections and 3D volume rendering of supragingival dental calculus (top panel) and subgingival dental calculus (bottom panel). Note that supragingival is porous compared to consistent stratification observed in subgingival while both contain similar ranges of mineral density values (MD Range: 1290–1770 mg/cc); C) Light microscope image at 10X showing various healthy tissues i.e. bone, PDL, cementum, CDJ, and dentin. XRF area maps illustrate concentration gradients in Ca, Zn, and P in mmol/cm3. Bottom panel is a bicolor map of Ca and Zn, with blue regions of Ca dominance and red regions of Zn dominance. Note: Same landmarks are shown in all panels. A line profile (white dotted line) in the Zn image map shows Zn concentration (mmol/cm3) vs. distance (mm). Line was drawn from bone to dentin, perpendicular to the Zn bands in cementum.

