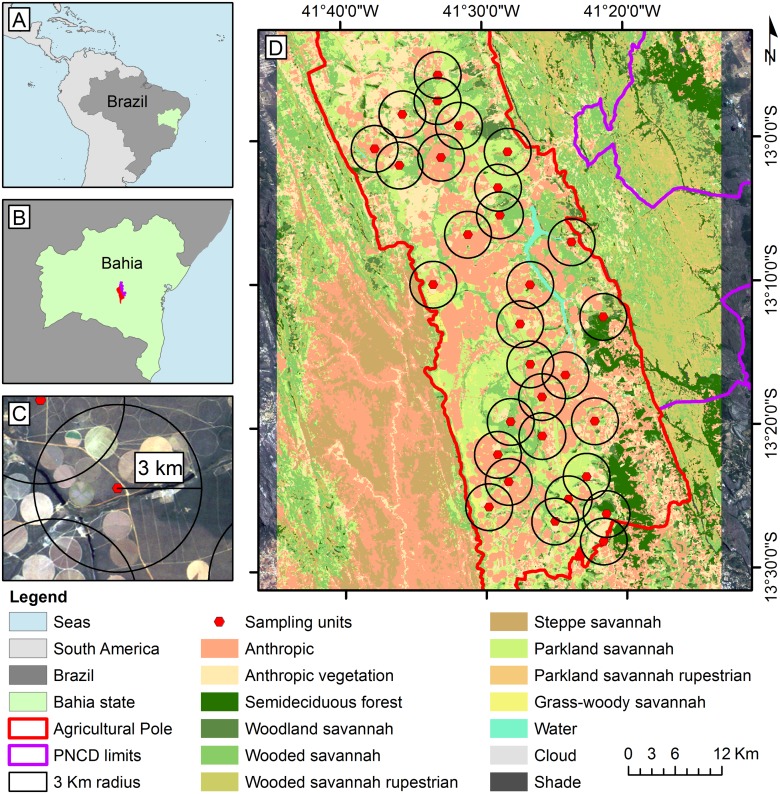
Fig 1.
Left side: A—highlighted in green, dark gray and light gray, the state of Bahia, Brazil and South America, respectively; B—At the center of the state of Bahia (green), the studied region, with the lands of the agricultural partnership in red and Chapada Diamantina National Park in purple; C—example of the 3 km buffer used for the selection of sampling units; D—arrangement of the 27 selected sampling units (red dots) in the study region and the land cover classification used for the calculation of landscape metrics.

