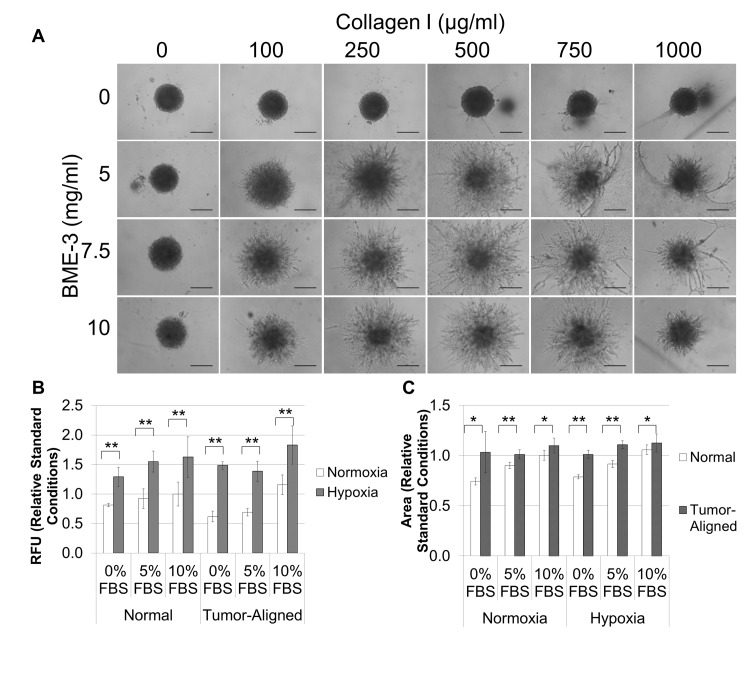
Fig 2. The optimal Invasion Matrix is 10 mg/ml BME, 250 μg/ml collagen-1, and MDA-MB-231 spheroids exhibit maximum proliferation and invasion when cultured in a tumor-aligned medium with 10% FBS under hypoxia.
A. MDA-MB-231 spheroids formed from 2,000 cells/well were embedded in hydrogels composed of different mixtures of BME (0, 5, 7.5, and 10 mg/ml) and collagen (0, 100, 250, and 750 μg/ml collagen-1). After polymerization, 100 ul of RPMI, 10% FBS was added to each well to elicit an invasive response and determine optimal matrix composition for invasion of cells out of the spheroid and into the surrounding matrix. B and C. Spheroids were formed as described above. After 72 hours, 50 μl of Invasion matrix or tumor-aligned invasion matrix were added to each well, and the plates were incubated at for 1 hour to polymerize hydrogel. Then, an additional 100 μl of medium (normal or tumor-aligned, as indicated above) containing the amount of FBS indicated was added to each well, and plates were incubated in either a normal cell culture incubator or a hypoxia chamber, as indicated above. Plates were read in a 96 well plate reader at excitation 540 nm/ 587 nm emission to compare proliferation of breast cancer cells (B), and spheroids were photographed using the TRITC filter to compare invasion of breast cancer cells (C). Each condition was assessed in quadruplicate after 96 hours. Photographs were analyzed using ImageJ to determine structure size which reflected cell invasion. Scale bar = 500 μm. *P < 0.05, **P < 0.01.

