
FIGURE 3.
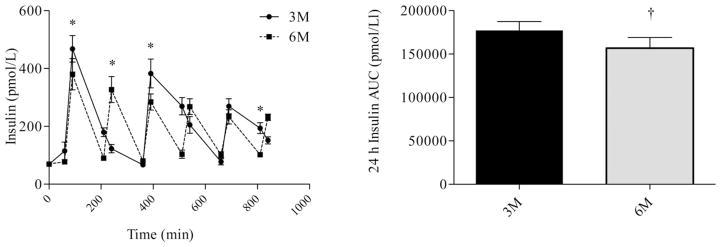
Insulin profiles (left) and insulin AUC (right) during the waking hours. The first sample was obtained at 0730 (prebreakfast) and the last sample was obtained at 2200 (corresponding to 30 min after the last meal in the six meal condition). * indicates significant difference between conditions, as determined by ANOVA. † indicates significant difference, as determined by paired t-test. 3M = three meals per day, 6M = six meals per day.