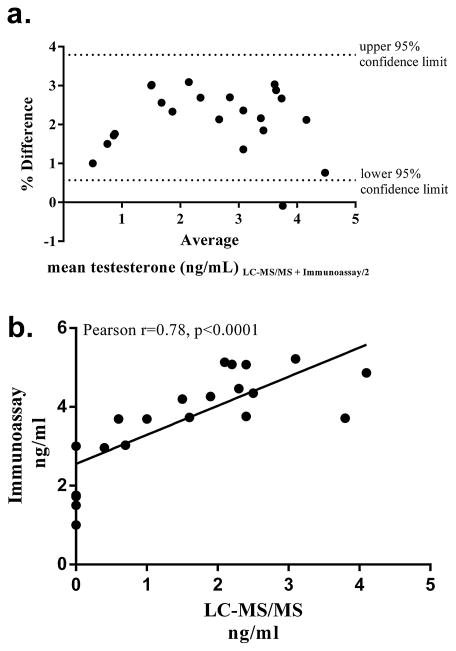
Fig. 3.
Comparison of testosterone measurement by LC–MS/MS and Beckman access II. (a) Bland Altman plot of percent differences in serum testosterone levels (immunoassay minus LC–MS/MS) against the average of the two methods. The dashed lines represent the upper and lower 95% confidence limits. (b) Pearson’s correlation analysis and linear regression between the two assays.

