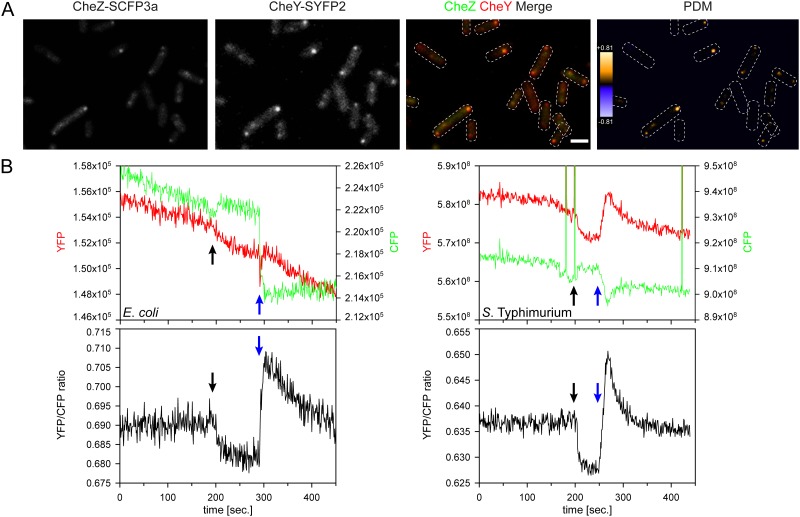
Fig 6. Localization and interaction of chemotaxis proteins CheY and CheZ.
(A) Fluorescence microscopy of S. Typhimurium MvP103 (ΔsseC) cells co-expressing CheY-SYFP2 and CheZ-SCFP3a fusion proteins from Expression clone pWRG415. Signals from CFP- and YFP channels are shown separately as well as merged and pseudo-colored as indicated. Both fusion proteins formed intense clusters at the poles of the bacterial cells. The product of the difference from the mean (PDM) of both channels was calculated and plotted to show sites of complex formation (orange). The shapes of individual bacteria were illustrated by dashed white lines. Scale bar = 1 μm, Scale in PDM image = positive covariance (orange) and negative covariance (blue) (B) The same Expression clone as in (A) was used to detect the dynamics of the CheY-Z interaction by FRET in E. coli VS104 [Δ(cheY-cheZ)] (left) and S. Typhimurium MvP103 (right) cells. The fluorescence intensities of the CFP (green) and YFP (red) channels are depicted in the upper graphs. The YFP/CFP ratios calculated from the fluorescence intensities are shown below. Addition (black arrows) and removal (blue arrows) of the chemotactic attractant MeAsp resulted in a decrease (no interaction) or increase (interaction) of the YFP/CFP quotient, respectively.

