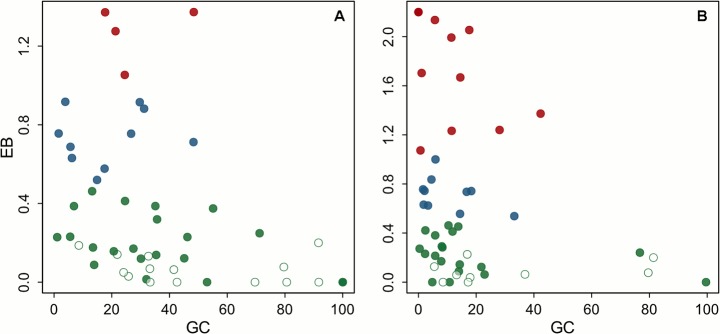
Fig 3. Relationship between geographic coverage and environmental bias in the protected areas network.

A) Scatterplot of the percent area protected (GC) and environmental bias (EB) per potential natural vegetation (PNV). The EB was computed as the absolute difference in the median of the MES1 for the protected areas and the whole PNV, divided by the median absolute deviation of MES1 in the PNV (see text for details). The PNVs are grouped in three classes with small (green), intermediate (blue) and large (red) EB values. Open green circles indicate that the EB does not significantly deviate from 0 (Mann–Whitney with Bonferroni adjustment, two-tailed p>0.05). B) As A, but the GC and EB values given for the PA 1 protected areas only.
