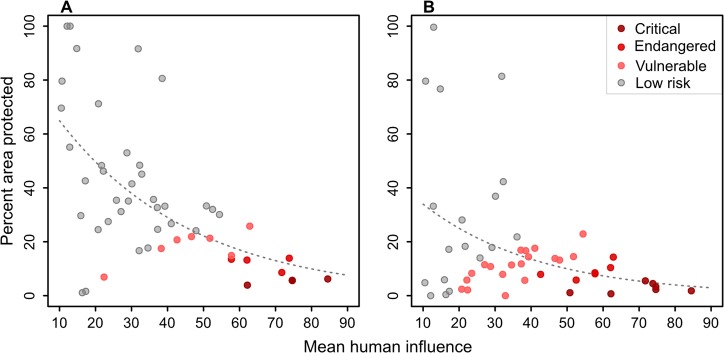
Fig 6. Conservation risk for potential natural vegetations.

A) Scatterplot of the average human influence (HIpnv) and the percent area protected (GC) for PNVs. We defined the CRI (conservation risk index) as the ratio between the HIpnv and the GC. PNVs with a HIpvn > 50 and a CRI > 10 were classified as critically endangered; PNVs with a HIpnv > 40 and CRI > 4 as endangered and PVNs with a HIpnv > 20 and CRI > 2 as vulnerable. All other PNVs were classified as low risk. Regression statistics: R2 = 0.35, p < 0.01. B) As A, but with the GC for the PA1 protected areas only. Regression statistics: R2 = 0.14, p = 0.02.
