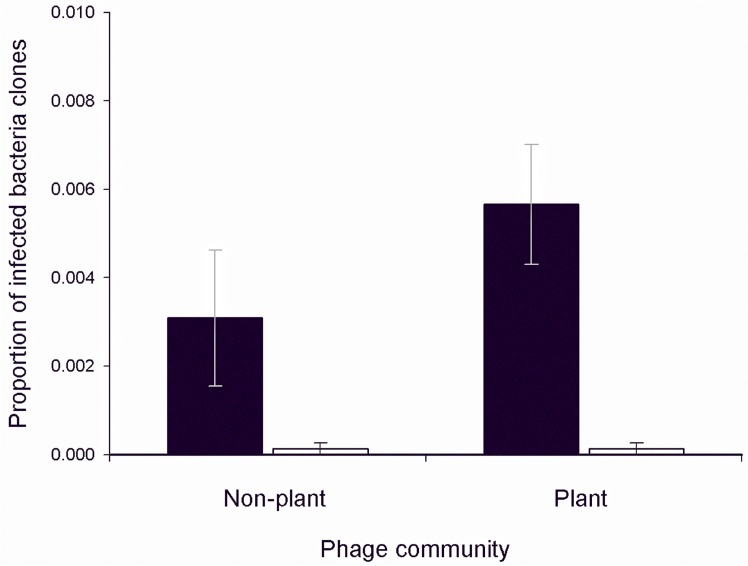
Fig 1. Proportion of infected bacteria clones.
Bars represent the mean proportion (±SEM) of all bacteria clones isolated from non-plant associated (black bar) and plant-associated (white bar) soils that are susceptible to be infected by their non-plant and plant phage communities averaged across the three time points.

