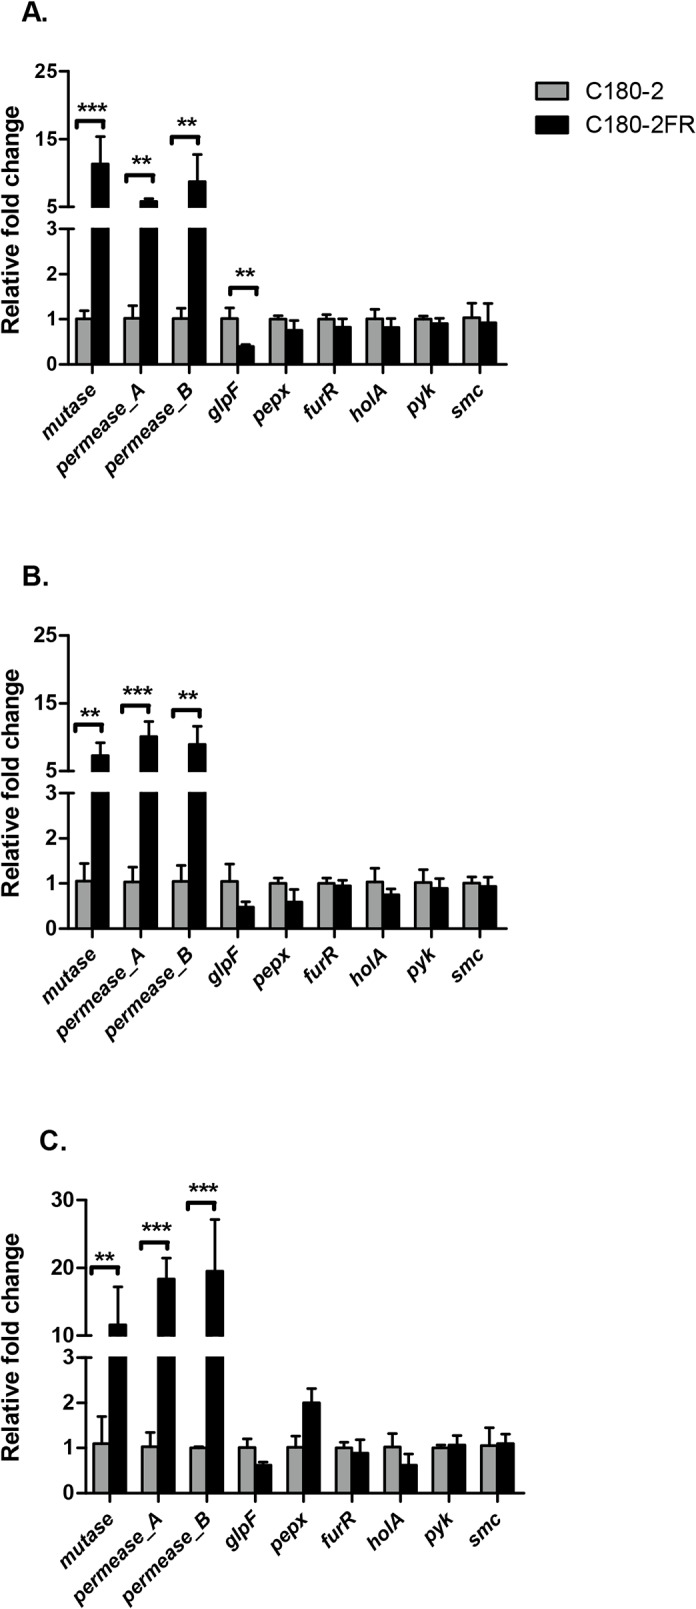
Fig 3. Comparison of gene expression between S. mutans C180-2 and C180-2FR.

S. mutans C180-2 and C180-2FR at early exponential phase (A), late exponential phase (B) and stationary phase (C). Overall expression of each selected gene in C180-2FR relative to that in C180-2 is presented as average fold-change ± SD. This experiment was repeated 3 times. All tested genes are categorized into three groups based on the type of relative fold changes. The significance level (α) was set at 0.005 (after Bonferroni correction). ** indicates p < 0.005. *** indicates p < 0.0005.
