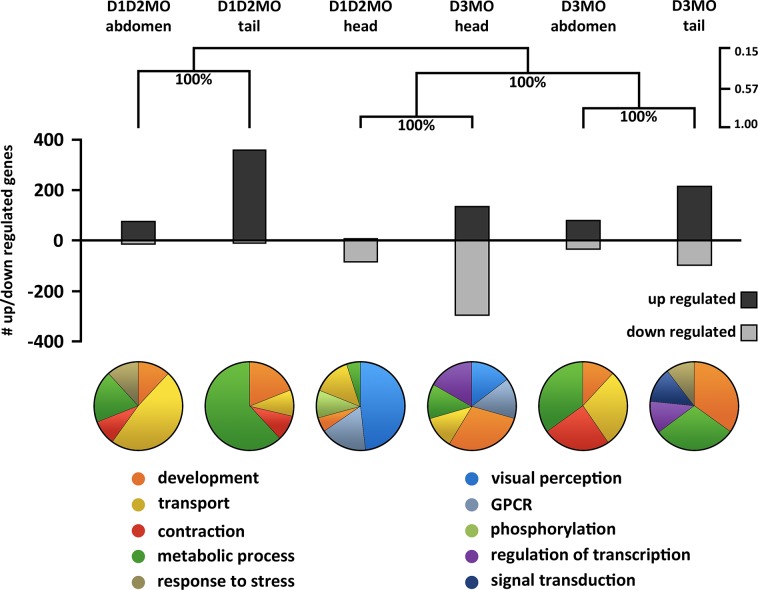
Fig 1. mRNA expression signature in head, abdomen and tail of deiodinase knockdown larvae at 72 hpf.
The results of unsupervised hierarchical clustering (Pearson correlation, average linkage) generated on the total set of significantly differentially expressed transcripts in D1D2MO and D3MO in the head (H), abdomen (A) and tail (T) regions are shown at the top. This analysis shows (dis)similarities among expression patterns in the different body parts of the deiodinase knockdowns. The transcriptional response in the head was similar in both deiodinase knockdowns, and distinct from that in other body parts. In contrast, the response in abdomen and tail was knockdown-specific but similar among these two body parts. Bootstrap support values (in %) are denoted at each node, showing the level of confidence in each step of the clustering. The legend on the right shows the Pearson correlation coefficient. The bar chart gives an overview of the number of up- and downregulated transcripts for each knockdown in each body part. Pie charts summarize the most important GO classes (gene ontology: biological process) affected by each knockdown in each body part. GO classes were manually grouped into broad biological categories. GO classes received a score calculated in Blast2GO based on the number of sequences they contained and the level of their specificity. GPCR = G-protein coupled receptor signalling pathway. D1D2MO: combination of deiodinase type 1 and type 2 morpholino-injected, D3MO: deiodinase type 3 morpholino-injected, and SCMO: standard control morpholino-injected.

