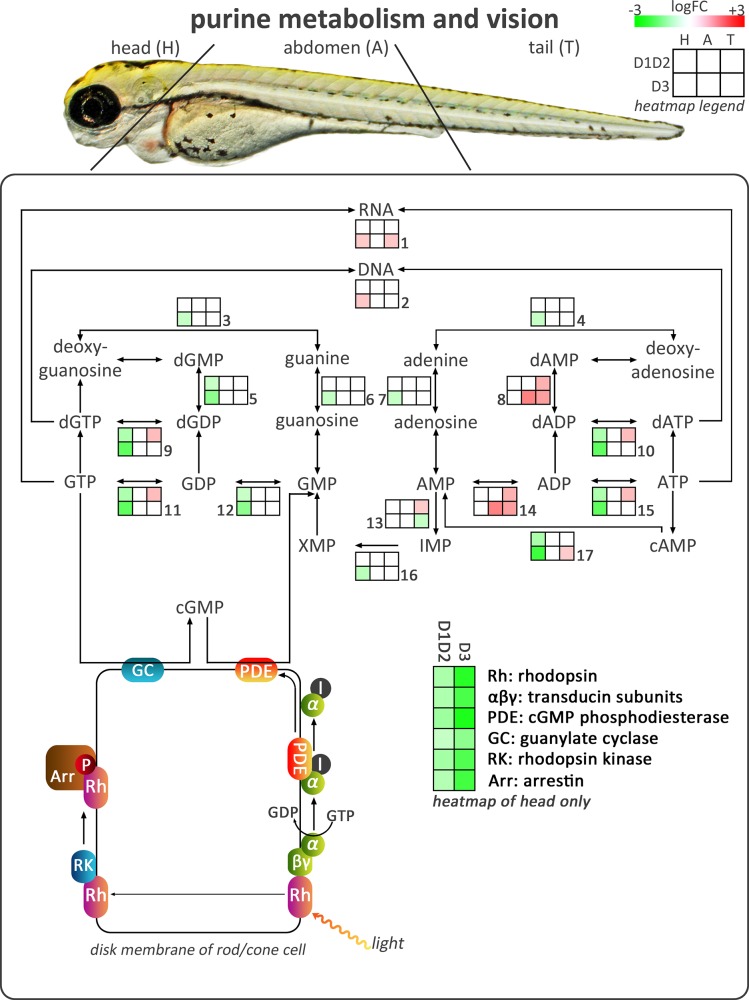
Fig 2. Overview of transcriptional effects on purine metabolism and vision.
The figure shows the affected part of the KEGG pathway ‘purine metabolism’, and its link to vision. Small heat maps show logFC values of differentially expressed transcripts coding for the enzymes involved in the pathway. Green indicates downregulated (Log2FC ≤ -0.585, FDR ≤ 0.05), and red indicates upregulated (Log2FC ≥ 0.585, FDR ≤ 0.05) transcripts. White boxes indicate that transcripts were not differentially expressed. D1D2: combination of deiodinase type 1 and type 2 morpholino-injected, D3: deiodinase type 3 morpholino-injected, I: inhibitory subunit of PDE. Numbers refer to S2 Table listing the details of the differentially expressed transcripts.

