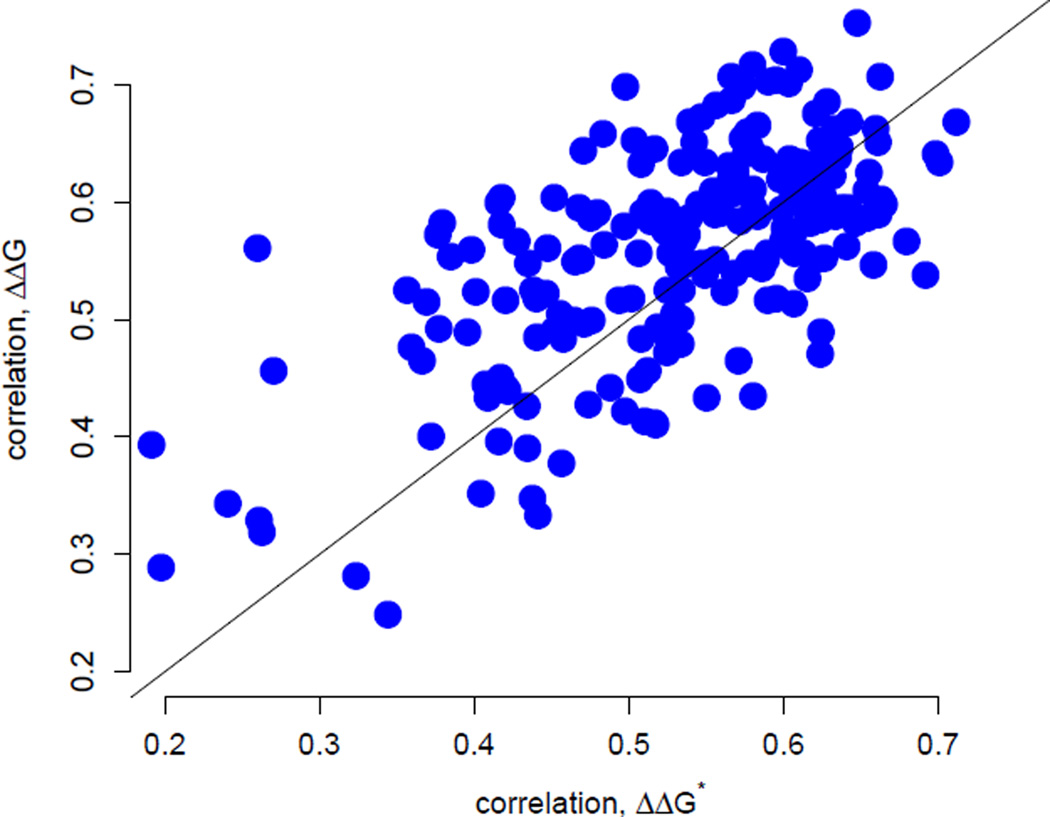
Figure 3.
Correlations between rates inferred by Rate4Site and rates predicted by either the stress ΔΔG*-based model (shown along the x axis) or the stability ΔΔG-based model (shown along the y axis). The correlation coefficients from the two models are significantly correlated (r = 0.64, P < 10−10). Correlations have similar magnitudes, with the ΔΔG-based model giving slightly better results on average (paired t-test, mean difference d̄ = 0.026, df = 208, P < 0.001). For 127 of the 209 proteins the stability model gives better correlations while for 82 of the 207 proteins the stress model gives better results.

